Fig. 10.
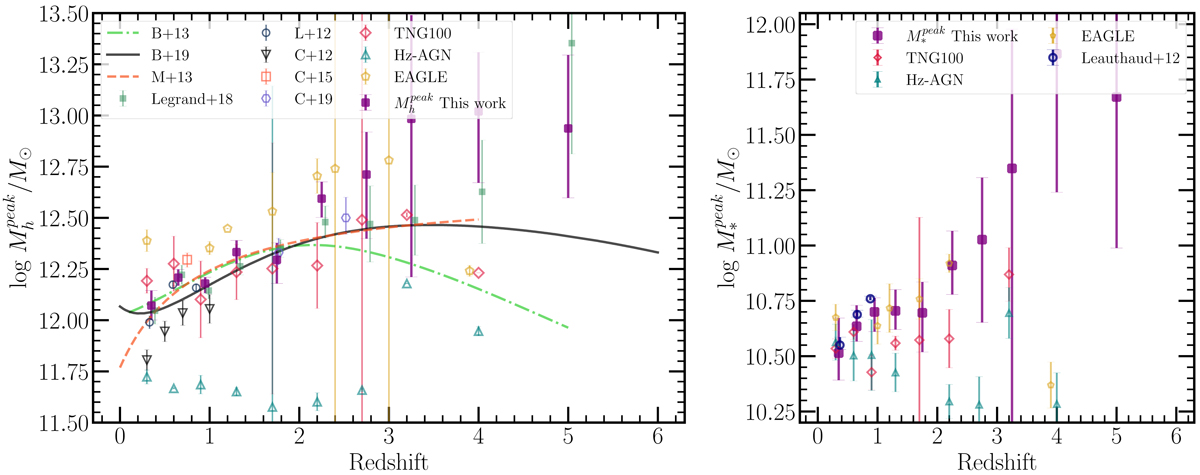
Download original image
Evolution of the peak halo (left panel) and peak stellar mass (right panel) with redshift. The results from our analysis are shown in purple points. For comparison, we show measurements from the literature rescaled to match our chosen value for H0 = 70 km s−1 Mpc−1. The literature measurements include Legrand et al. (2019), Leauthaud et al. (2012, L+12), Coupon et al. (2012, C+12), Coupon et al. (2015, C+15), Cowley et al. (2018, C+18), Moster et al. (2013, M+13), Behroozi et al. (2013, B+13), Behroozi et al. (2019, B+19), and from the hydrodynamic simulations HORIZON-AGN, TNG100, and EAGLE (references in the main text).
Current usage metrics show cumulative count of Article Views (full-text article views including HTML views, PDF and ePub downloads, according to the available data) and Abstracts Views on Vision4Press platform.
Data correspond to usage on the plateform after 2015. The current usage metrics is available 48-96 hours after online publication and is updated daily on week days.
Initial download of the metrics may take a while.