Fig. 9
Download original image
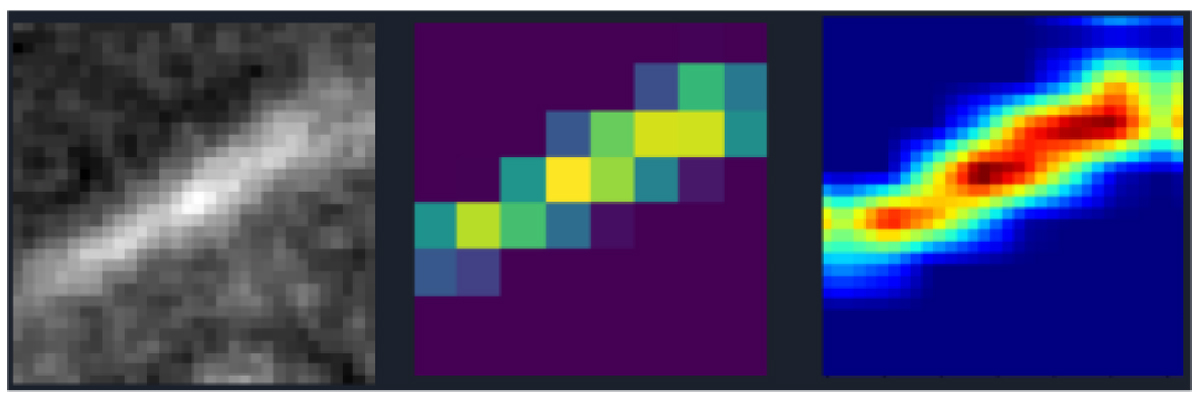
Illustration the Grad-CAM function that helps identifying the regions of interest in the image that triggered the O’TRAIN classification. Left: residual cutout (32 × 32 pixels) of a bogus identified in the JAST telescope images. Center: the GRAD-CAM Heatmap (8 × 8 pixels) showing the final feature maps × their importance where our O’TRAIN CNN focused on to take its decision. Right: rescaled Grad-CAM heat map (32 × 32 pixels) for a direct comparison with the cutout.
Current usage metrics show cumulative count of Article Views (full-text article views including HTML views, PDF and ePub downloads, according to the available data) and Abstracts Views on Vision4Press platform.
Data correspond to usage on the plateform after 2015. The current usage metrics is available 48-96 hours after online publication and is updated daily on week days.
Initial download of the metrics may take a while.