Fig. A.1
Download original image
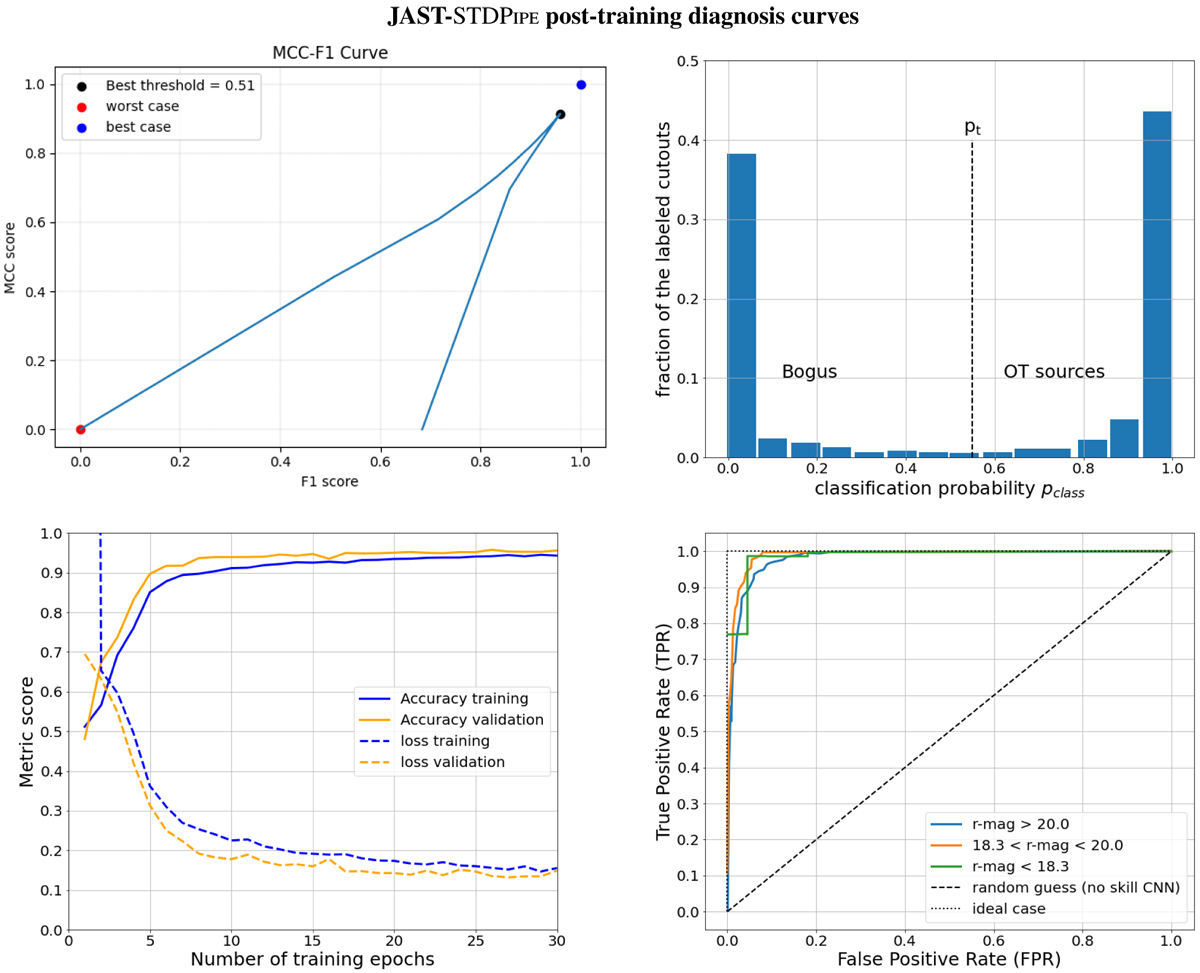
Different visualisations of the metrics used to evaluate the performance of the O’TRAIN model trained on the JAST-STDPipe data cube. Top left: Evolution of the MCC and F1-score as a function of different values of pt. The value pt = 0.51 (best threshold) maximises both the MCC and F1-score. Top right: Classification probability distribution of the validation data set at the last epoch of the training. Bottom left: Evolution of the accuracy and loss metrics as a function of the number of training epochs. Bottom right:) ROC curve per bin of the OT candidate magnitudes in order to diagnose the behaviour of the O’TRAIN model for different source brightness.
Current usage metrics show cumulative count of Article Views (full-text article views including HTML views, PDF and ePub downloads, according to the available data) and Abstracts Views on Vision4Press platform.
Data correspond to usage on the plateform after 2015. The current usage metrics is available 48-96 hours after online publication and is updated daily on week days.
Initial download of the metrics may take a while.