Fig. 11
Download original image
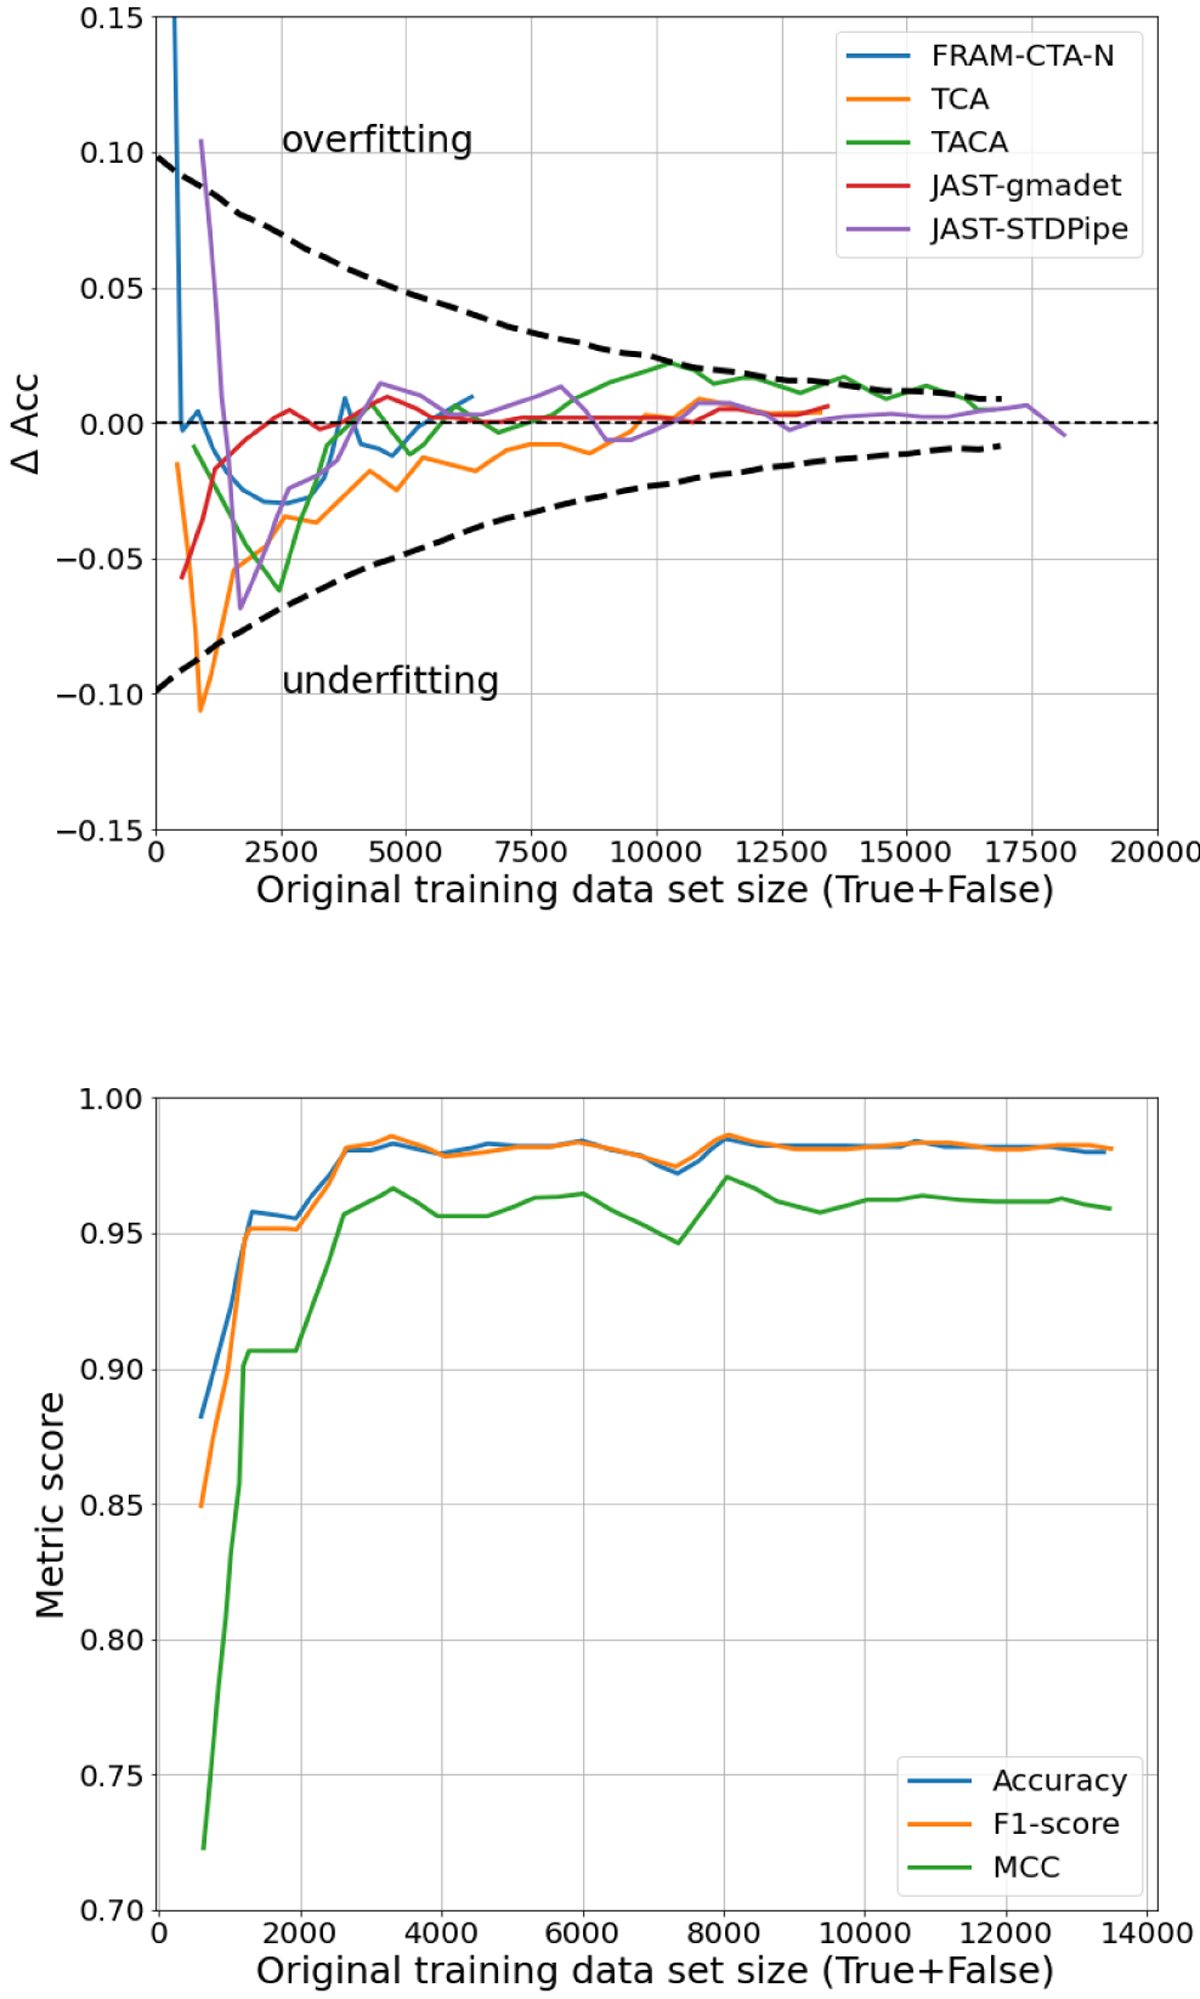
Top: Evolution of ∆Acc between the batch and the validation data sets as function of the size of the initial training data set after 25 epochs. This visualisation allows to quickly identify if the CNN algorithm is in an over(under)fitting regime (outliers of the dashed lines). Bottom: Evolution of three metrics: accuracy, F1-score and MCC as a function of the training data set size (JAST-gmadet).
Current usage metrics show cumulative count of Article Views (full-text article views including HTML views, PDF and ePub downloads, according to the available data) and Abstracts Views on Vision4Press platform.
Data correspond to usage on the plateform after 2015. The current usage metrics is available 48-96 hours after online publication and is updated daily on week days.
Initial download of the metrics may take a while.