| Issue |
A&A
Volume 664, August 2022
|
|
|---|---|---|
| Article Number | A41 | |
| Number of page(s) | 11 | |
| Section | Extragalactic astronomy | |
| DOI | https://doi.org/10.1051/0004-6361/202142894 | |
| Published online | 03 August 2022 | |
Properties of intra-cluster low-mass X-ray binaries in Fornax globular clusters
1
Department of Physics, University of Naples Federico II, C.U. Monte Sant’Angelo, Via Cinthia, 80126 Naples, Italy
e-mail: gabriele.riccio@ncbj.gov.pl
2
INFN – Sezione di Napoli, 80126 Naples, Italy
3
INAF-Osservatorio astronomico di Capodimonte, Via Moiariello 16, 30131 Naples, Italy
4
INAF-Oss.dell’Abruzzo, 64100 Teramo, Italy
5
Harvard-Smithsonian Center for Astrophysics, Cambridge, MA 02138, USA
6
Steward Observatory, University of Arizona, 933 N. Cherry Ave., Tucson, AZ 85719, USA
7
School of Astronomy and Space Science, Nanjing University, Nanjing, PR China
8
Institute of Astrophysics, Pontificia Universidad Católica de Chile, Av. Vicuña Mackenna 4860, 7820436 Macul, Santiago, Chile
9
European Southern Observatory, Santiago, Chile
10
Research Centre for Astronomy, Astrophysics & Astrophotonics, Macquarie University, Sydney, NSW 2109, Australia
11
Department of Physics & Astronomy, Macquarie University, Sydney, NSW 2109, Australia
Received:
13
December
2021
Accepted:
24
May
2022
Aims. We present a study of the intra-cluster population of low-mass X-ray binaries (LMXB) residing in globular clusters (GC) in the central 1 deg2 of the Fornax galaxy cluster. Differently from previous studies, which were restricted to the innermost regions of individual galaxies, this work is aimed at comparing the properties of the intra-cluster population of GC-LMXBs with those of the host galaxy.
Methods. The data used in this work are a combination of the VLT Survey Telescope (VST) and Chandra observations. We performed a cross-match between the optical and the X-ray catalogue in order to identify the LMXBs residing in GCs. We divided the GC-LMXBs into host-galaxy and intra-cluster objects based on their distance from the nearest galaxy in terms of effective radius (Reff). We found 82 intra-cluster GC-LMXBs and 86 objects that are hosted in galaxies. As the formation of LMXBs also depends on the host GC colour, we performed a Gaussian mixture model to divide the population into red and blue GCs.
Results. As has been found for the innermost regions of galaxies, LMXBs tend to form in red and bright GCs in intra-cluster space as well. We find, however, that the likelihood of a red GC to host an LMXB decreases with galactocentric distance, but it remains approximately constant for the blue GC population. Investigating the X-ray properties of the LMXBs residing in GCs, we find a difference in the X-ray luminosity function between the intra-cluster and host-galaxy sample: both follow a power-law down to ∼8.5 × 1037 erg s−1, which is consistent with field LMXBs for the intra-cluster sample, while the latter agree with previous estimates for LMXBs in GCs. We observe a deficiency of bright LMXBs in blue intra-cluster GCs, however. This might indicate a lack of black hole binaries in metal-poor systems. We further investigated the spectral properties of the GC-LMXBs through their hardness-ratio. We detect a tentative difference in the hardness ratio of two populations, where the intra-cluster GC-LMXBs appear to have harder spectra than the host-galaxy objects. We find the same trend when we compare red and blue GC-LMXBs: the spectra of the blue sample are harder spectra than those of the red sample. This result could suggest a relation between the spectral properties of LMXBs and the host GC colour and therefore its metallicity. We discuss the possibilities of spatial biases due to uncertainties in the X-ray spectral response correction and due to contamination by background active galactic nuclei.
Key words: X-rays: binaries / galaxies: clusters: individual: Fornax / galaxies: star clusters: general / X-rays: galaxies: clusters
© G. Riccio et al. 2022
 Open Access article, published by EDP Sciences, under the terms of the Creative Commons Attribution License (https://creativecommons.org/licenses/by/4.0), which permits unrestricted use, distribution, and reproduction in any medium, provided the original work is properly cited.
This article is published in open access under the Subscribe-to-Open model. Subscribe to A&A to support open access publication.
1. Introduction
Low-mass X-ray binaries (LMXBs) are stellar systems composed of an extremely dense object (a neutron star or black hole) that accretes mass from a secondary star (a main-sequence star of about one solar mass). They represent the dominant X-ray binary (XRB) population in early-type galaxies. It has been shown that a significant fraction of LMXBs resides in GCs. This varies from 10%–20% in small galaxies and reaches ∼70% in cD galaxies, depending on the morphological type of the galaxy and on the specific abundance of the GCs (e.g., Kim et al. 2009).
The GC-LMXB association is particularly interesting as the high stellar density near the centre of GCs may trigger the formation of binaries either by three-body process or by tidal capture. It was observed that LMXBs tend to form in bright GCs, as expected if the luminosity is a proxy for the total number of stars they contain (Fabbiano 2006, and references therein). On the other hand, size and concentration reflect the efficiency of dynamical interaction and favour binary formation in dense environments. Furthermore, the formation can also be influenced by the mass, size, and metallicity of GCs. Red metal-rich GCs are about three times more likely to host LMXB than blue (metal-poor) GCs, in part because red GCs are denser on average than the blue counterpart (Jordán et al. 2004; Fabbiano 2006; Paolillo et al. 2011; D’Ago et al. 2014 and references therein). However, the role played by metallicity in LMXB formation is still unclear, and understanding this connection would help us to know how these objects are formed, and if the properties of the environment (the host GC or the galaxy properties) can have an impact on the structure and emission of the LMXB.
The fact that the spatial distribution of GC-LMXBs in early-type galaxies usually follows the distribution of the host GC population well (Paolillo et al. 2011) suggests that the likelihood of LMXB formation is mainly driven by the internal GC properties. However, there have been claims that LMXBs may be less concentrated than GCs around giant ellipticals, suggesting that environmental effects may influence the formation and evolution of LMXBs. Unfortunately, most studies so far were limited to the central regions of galaxies because the area explored by past surveys (Hubble Space Telescope) was limited and high-resolution imaging was lacking. This imaging is needed to select and measure the structural parameters of extragalactic GCs. This has prevented studies of the effect of the distance from the galaxy centre on the formation of LMXBs inside GCs. Because the spatial distribution of the red and blue GCs changes according to the distance from the galaxy, moreover, wide-field observations are required to distinguish the different physical processes at work in a scenario in which red GCs are associated with the main body of the galaxy while the blue GCs are associated with the halo (Cantiello et al. 2018).
Significant populations of intra-cluster GCs have been discovered in the Virgo (Durrell et al. 2014) and in the Fornax galaxy cluster. Using the VLT Survey Telescope wide-field imaging obtained within the Fornax Deep Survey (FDS, Iodice et al. 2016) in the Fornax cluster, our collaboration has proved the existence of a vast population of intra-cluster stellar systems extending out to a significant fraction of the viral radius (D’Abrusco et al. 2016; Cantiello et al. 2018, 2020). This was found to match the distribution of the intra-cluster light (Iodice et al. 2017), thus tracing the past dynamical evolution of the galaxy cluster itself. In addition, Jin et al. (2019) discovered a population of field LMXBs throughout the cluster, around the dominant cD galaxy NGC 1399, by analysing Chandra archival images.
In this work, we investigate the properties of LMXBs residing in this extended population of intra-cluster GCs making use of the latest FDS data release, combined with Chandra X-ray data covering the core of the Fornax galaxy cluster. Based on this, we study the GC-LMXB connection within the whole Fornax cluster and its dependence on host galaxy, environment, galactocentric distance, and metallicity.
2. Dataset
This work is based on the combination of VST and Chandra data. We briefly summarize the main properties of the datasets. We refer to the cited papers for more details.
2.1. Optical data
The optical data used were acquired as part of the Fornax FDS based on observations obtained in u, g, r, and i bands with the Survey Telescope (VST) of the Very Large Telescope at the ESO Paranal Observatory. The VST is a wide-field optical imaging telescope with a 2.6-meter aperture with a field of view (FoV) of 1 degree2. The telescope is equipped with the 268 megapixel OmegaCAM with a pixel scale of  pixel−1. The survey was designed to map the entire Fornax cluster out to the virial radius, and it also covered the NGC 1316 subgroup (Iodice et al. 2017). Located at a distance of D = 20.13 ± 0.4 Mpc (Blakeslee et al. 2009), this cluster is the second nearest to us after the Virgo cluster and therefore represents an ideal target for this type of study. The survey observed ∼27 square degrees approximately centred on NGC 1399 and NGC 1316 (Cantiello et al. 2020), reaching magnitude limits for point-like sources of 24.1, 25.2, 24.6, and 23.6 in the u, g, r, and i bands, respectively (AB mag photometric system), while the median seeing of the observation ranges from 0.6 to 1.1 arcsec. We limit our analysis to the central 1.5 square degrees around NGC 1399, which overlaps with the Chandra X-ray coverage of the cluster core. The data reduction was performed using the Astro-WISE pipeline (see e.g., Venhola et al. 2019). This is a tool for the reduction of large field data to perform pre-reduction (subtraction of bias, correction of flat), illumination, and edge correction and photometric and astrometric calibrations. To properly detect and study GCs, we need to minimize the contamination from the brightest galaxies in the cluster (e.g., NGC 1399 and NGC 1404). In order to model and subtract the galaxies, ELLIPSE task in IRAF STSDAS is used during the catalogue preparation (Jedrzejewski et al. 1987). To produce a complete catalogue of all sources present in the VST field of view, a combination of SExtractor (Bertin & Arnouts 1996) and DAOphot (Stetson 1987) was used on the galaxy-subtracted frame independently in each filter. For additional information on the data reduction and source photometry, we refer to Cantiello et al. (2020).
At the Fornax distance, GCs appear unresolved from the ground. They are therefore hard to separate from stars and compact background galaxies. The selection of the GC sample accordingly represents a crucial step in our analysis. In this case, we adopted the approach presented in Cantiello et al. (2018) applied to the improved FDS dataset (Cantiello et al. 2020). The GC selection criteria were defined using the training set of spectroscopically confirmed GCs published in Pota et al. (2018) and Schuberth et al. (2010). We refer to Fig. 1 of Pota et al. (2018) for the region covered by the confirmed GCs.
In order to minimize the contamination from foreground sources, we further discarded all sources with a g magnitude brighter than MTO − 3σGCLF, where MTO is defined as the absolute magnitude turn-off of the Gaussian GC luminosity distribution, assuming σGCLF = 1.4 ± 0.1 mag and MTO = −7.4 ± 0.2 mag (e.g., Villegas et al. 2010). At the distance of Fornax, the turn-over magnitude corresponds to mTO ∼ 24.0 mag. The adopted selection criteria are given in Table 1.
Selection criteria for the GC candidates.
The catalogue of candidate GCs contains 5178 sources. Their spatial distribution is shown in Fig. 1. The figure shows the extended distribution of GCs that was reported by D’Abrusco et al. (2016). While a large fraction of these GCs are clustered around the brightest galaxies, many GCs occupy the intra-cluster space, several effective radii (Reff) away from any cluster galaxy member. The positions of cluster galaxies and their effective radii are extracted from Ferguson (1997). In Table 2 we show the Reff of the galaxies in the FoV of the Chandra observations. We point out that the Reff of NGC 1399 and NGC 1404 are considerably smaller than those reported in Iodice et al. (2016) and Iodice et al. (2019). These values were estimated using very deep observations probing very low surface brightnesses where the extended stellar halos of NGC 1399 (and NGC 1404) merge with the intra-cluster light and encompass most of the Fornax cluster. To identify intra-cluster sources, we therefore preferred to use the value provided by Ferguson (1997).
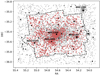 |
Fig. 1. Spatial distribution of the GCs (grey points) and the X-ray sources (red crosses) centred on NGC 1399. The solid black circles represent bright galaxies in the cluster from Ferguson (1997). The size is proportional to their effective radii. The dashed line highlights the FoV of Chandra observations. |
List of galaxies from Ferguson (1997) in the Chandra FoV.
The completeness of the original gri catalogue is ∼80% for magnitudes g ≤ 24 mag. However, the selection criteria introduced above in order to minimize the contamination of foreground/background sources combined with the use of the shallower u band constrain the actual completeness of our sample, as shown in Fig. 2. We note that because LMXBs tend to reside in bright GC, the final detection limit of mg ∼ 25 does not represent a significant limitation for our study.
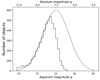 |
Fig. 2. Luminosity function in g band for the sample of candidate GCs. The dashed black line corresponds to the expected theoretical GC luminosity function (with values μ = 24 and σ = 1.4). |
The colour distribution of GCs in the core of the Fornax cluster is known to be bimodal, mainly due to metallicity effects (see e.g., D’Abrusco et al. 2016; Cantiello et al. 2018, and references therein). In order to study the possible differences between LMXBs formed in different environments, we used a Gaussian mixture model (GMM; Muratov & Gnedin 2010) to divide the whole population into red and blue GCs. Using a g − i ∼ 1.00 threshold, we find 2085 red GCs (∼40% of the total sample) and 3093 blue GCs (∼60% of the total sample). As discussed in more detail below, the relevance of each population is dependent on several factors, including the host galaxy properties, the galactocentric distance of the cluster, and the environment. We adopted a fixed colour threshold as we intend to study the overall intra-cluster population, independently of the individual galaxies. We therefore ignored for the moment the variations in the GC colour distribution as a function of the distance from the centres of the host galaxies (Kim et al. 2013; Cantiello et al. 2015) and the differences of the red/blue bimodality of the individual GCs (Jordán et al. 2015). In Fig. 3 we plot the GMM model over the g − i colour distribution for the entire sample of candidate GCs. We point out that on cluster scales, the blue component dominates 3:2 of the total GC population. This is different from what has been reported close to individual galaxies, where red GCs are dominant (e.g., Puzia et al. 2014). This agrees with the well-known trend for red and blue GC densities to have different radial gradients, the latter of which are shallower than the former. We note that the bulk of the blue GC population is redder than what was found for Fornax dwarf galaxies in any case (Prole et al. 2019).
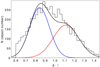 |
Fig. 3. g − i colour distribution of GC candidates in the central square degree of the Fornax cluster. The smooth solid black, red, and blue lines show the GMM model for the total, red, and blue populations. |
However, we tried to quantify the variation in the colour distribution as a function of the distance by performing a GMM fit for different distances from each galaxy in terms of effective radius. We find a slight shift in the average value of each distribution towards more blue colours in progressively outer regions (Fig. 4). The slope of the fit is found to be −0.0037 ± 0.0005 for the blue sample and −0.0037 ± 0.0017 for the red sample. This is inconsistent/marginally consistent (∼2.2σ), respectively, with a constant trend. This means that not only does the intra-cluster space host a larger fraction of blue GCs, but also that both distributions gradually become bluer with increasing distance. For this result, we do not expect any systematic effect from background galaxy light because it was removed during the catalogue reduction process (Cantiello et al. 2020).
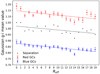 |
Fig. 4. Mean values calculated by the GMM for different distances from each galaxy in terms of Reff for red and blue GCs, and the separation performed by the GMM. The error bars correspond to the standard deviation of the mean. |
2.2. X-ray data
The X-ray data were extracted from 29 archival Chandra observations (given in Table 1 of Jin et al. 2019) that were obtained with the Advanced CCD Imaging Spectrometer (ACIS) for a total exposure time of 1.3 Ms. This covers large part of the central region of the Fornax cluster (Fig. 1). The details of the source detection procedure can be found in Jin et al. (2019). We briefly summarize the procedure here. The X-ray data were analysed using the Chandra Interactive Analysis of Observation (CIAO) tool Wavdetect, producing counts and exposure maps, at the native pixel scale of 0.49″, in three different bands: 0.5–2 (S band), 2–8 (H band), and 0.5–8 (F band) KeV. The exposure maps were weighted by an assumed incident spectrum of an absorbed power law with a photon index of 1.7 and an absorption column density NH = 1021 cm−2. This latter value is higher than the Galactic foreground absorption column (∼1.5 × 1020 cm−2), but takes some intrinsic absorption of the LMXBs into account (see Jin et al. 2019).
The centroids of the sources were refined using a maximum likelihood method that iterates over the positions of the individual counts within the 90% of the enclosed counts radius (ECR). The photon fluxes in various bands were calculated using a circular opening of 90% of the ECR in non-crowded zones and 50% for the crowded zones to avoid contamination between nearby sources. The position uncertainty (PU) at the 68% confidence level was estimated following the empirical relation between PU, source counts, and source position in terms of the off-axis angle. At this point, a catalogue of 1279 independent sources was obtained, of which 1177 are in F band (0.5–8 KeV), 924 in S band (0.5–2 KeV), and 713 in H band (2–8 KeV). To derive the unabsorbed energy flux in the F band, a photon-to-flux conversion of 3.64 × 10⁻⁹ erg ph−1 was used, assuming the previously cited incident source spectrum.
In order to verify the quality and completeness of the catalogue, we compared it to the Chandra Source Catalog 2.0 (CSC master catalogue1). The CSC uses a different approach to compute the source fluxes (based on the individual photon energy instead of assuming an average conversion factor) and the exposure maps. In order to compare the two catalogues, we therefore cross-matched the source positions and compared the fluxes of the sources in common, deriving the rescaling factor (r = 1.41) from CSC to Jin et al. (2019). In Fig. 5 we show the cumulative X-ray luminosity function of the two catalogues after correcting the CSC fluxes as explained above. Both catalogues follow a similar truncated power-law distribution down to LF ≃ 3 × 1038 erg s−1, after which the CSC LF flattens more rapidly than the Jin catalogue. The higher completeness of the Jin catalogue is due to two main factors: first, the CSC contains observations up to 2014, while the catalogue of Jin et al. (2019) is based on all available Chandra archived observations up to 2015. Of the 29 observations used in Jin et al. (2019), the CSC lacks the two identified with ObsIDs 17549 and 14529, which are centreed on NGC 1399 and NGC 1404, where a large fraction of the GC population resides. Second, the CSC reports source properties in master, stack, and per-observation tables. A single source might then not be included in the master catalogue (used here) but might have entries at the stack or observation level. We verified that when we include sources from all tables, we obtain a comparable number of sources between the CSC and Jin catalogue (1004 and 1177, respectively), and this considerably reduces the disagreement. However, in this case, the choice for the measured properties that are used becomes complex2. For this reason, we mainly used the Jin et al. (2019) source catalogue and reverted to the CSC for specific measurements and tests. Most of our result would be confirmed, although with lower significance, using the CSC catalogue in any case, except for the hardness-ratio differences discussed in Sect. 4.2.
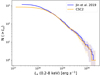 |
Fig. 5. Cumulative X-ray luminosity function for the sources from the catalogue of Jin et al. (2019) and for the CSC catalogue. The shaded region represents the 1σ error. |
3. Identification of X-ray sources in GCs
In order to study the population of LMXBs residing in GCs, we performed a cross-match between the optical and the X-ray catalogues. To minimize the possibility of random matches, we employed the PU provided in the Jin et al. (2019) catalogue as matching radius for the X-ray sources. This is different for each object. For the optical sources, we chose a matching radius of 0.5 arcsec that is typical of the VST astrometric accuracy (see e.g., Capaccioli et al. 2015). Two sources were considered to match when the separation between their positions did not exceed the sum of the two matching radii for the corresponding source. Based on the optical and X-ray source densities, we expect three false matches over the entire FoV. In addition, compact background galaxies hosting an active galactic nucleus (AGN) might be mistaken for GCs hosting an LMXB. This type of contamination is discussed in Sect. 4.2. We identify 168 X-ray sources that are positionally coincident with GCs. We refer to these objects as GC-LMXBs.
To study the photometric properties of the intra-cluster population, we divided the GC-LMXBs sources into host-galaxy and intra-cluster objects based on their projected distance from the nearest galaxy in terms of Reff. The choice on where to place the separation between the regions associated with the galaxy and the intra-cluster space is somewhat arbitrary.
Several authors considered 5 Reff to be the upper limit for bound systems (Kartha et al. 2014; Forbes 2017; Caso et al. 2019). In order to obtain a nearly equal number of host-galaxy/intra-cluster sources, we considered as intra-cluster GCs those lying more than 6 Reff from the nearest galaxy. In this way, we found 86 host-galaxy and 82 intra-cluster GC-LMXBs. Coincidentally for NGC 1399, this limit roughly corresponds to the separation between the central region covered by HST data (Paolillo et al. 2011) and the outer cluster region that has only been studied with ground-based data so far. Due to projection effects, some intra-cluster sources will be included in the host-galaxy sample. However, our conservative choice should ensure that most of the sources that are classified as intra-cluster objects are loosely bound to individual galaxies. In Fig. 6 we show the distribution of intra-cluster and host-galaxy GC-LMXBs in our field of view. The majority of intra-cluster sources are located in the central cluster region around NGC 1399.
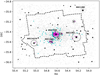 |
Fig. 6. Spatial distribution of intra-cluster (cyan crosses) and host-galaxy (magenta crosses) GC-LMXBs. Cluster galaxies are the solid black circles, and the sizes are proportional to their effective radii. The dashed circle shows the 6 Reff distance from the galaxy centre. The dashed line depicts the FoV of the Chandra observations. |
In Fig. 7 we show the fraction of GC hosting LMXBs (XGC) as a function of the distance from the nearest galaxy in terms of Reff for the entire GC sample, as well as red and blue GC subsamples. These fractions are normalized to the number of all, red, and blue GCs in the corresponding distance bin. We refer to this as fXGC, frXGC, and fbXGC for the total, red, and blue fraction of XGCs, respectively. We selected only GCs with a magnitude g < 23.5 (the 90% completeness limit of the GC catalogue, see Fig. 2) in order to minimize the radial dependence on the optical completeness. We further verified that the same trends were confirmed when only LMXBs above the median sensitivity limit Lx > 1.7 × 1038 erg s−1 of Jin et al. (2019) were selected (corresponding to a photon flux of 1.5 × 10⁻⁶ ph s−1 cm−2 in their Fig. 2). In this way, we also minimized the dependence on the variable X-ray completeness across the FoV.
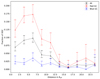 |
Fig. 7. Fraction of XGC as a function of the distance in units of Reff for the total, red, and blue sample of GCs. The fraction is defined as the number of total, red, or blue XGC divided by the respective total number of GCs in the distance bin. The distances on the X-axis are from the nearest galaxy to the object. |
Figure 7 shows that the likelihood of a red GC to host an LMXB decreases with galactocentric distance, but remains approximately constant for the blue GC population. We find the host-galaxy fraction of red XGC frXGC = 0.154 ± 0.017 to be significantly different from the respective intra-cluster value frXGC = 0.062 ± 0.008. On the other hand, the host-galaxy fraction of blue XGCs fbXGC = 0.021 ± 0.006 appears consistent within the errors but is still higher than that of the intra-cluster counterparts fbXGC = 0.013 ± 0.003. Because of the normalization we adopted, this result is independent of the known different radial distribution of red and blue GCs. The former follow the galaxy light more closely than the latter (which represent the dominant intra-cluster GC population). Thus, the clustering of LMXBs around bright galaxies is due to the combined effects of the steeper profile of the red GC population and the increased likelihood to host LMXBs close to the galaxy centre. Previous studies targeting nearby elliptical galaxies on spatial scales comparable to ours, such as Kim et al. (2006), show that frXGC can range from 2.7% up to 13% from one galaxy to the next (the latter value refers to NGC 1399), while fbXGC remain relatively constant at ∼2%, except for NGC 1399, where it reaches 5.8%. We thus find a strong agreement between our host-galaxy frXGC and the measurement carried out by Kim et al. (2006) on NGC 1399, suggesting that our sample of host-galaxy red XGC is dominated by the population associated with the central cluster galaxy. In the case of blue XGCs, the fraction we measure is closer to the average, suggesting that blue GCs are more related to the overall cluster environment than to a single galaxy, as discussed in more detail below.
Because the formation of LMXBs is strongly influenced by the luminosity of the host GC, the drop in the fraction of GC-LMXB could be associated with an average decrease in the GC luminosity towards the outer regions. In Fig. 8 we show the GC g-band magnitude as a function of galactocentric distance. The dashed blue and red lines represent the mean magnitude for the blue and red sample, respectively. We can observe no clear decrease in the mean magnitude towards the outer regions, which might justify the drop of the GC-LMXB fraction. This might suggest that the LMXB formation is favoured in the proximity of galaxies, or that it might also depend on other factors, such as the environment of the host galaxy.
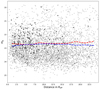 |
Fig. 8. Magnitude in g band as a function of the distance in terms of Reff. Grey circles and triangles represent red and blue GCs, respectively. Black crosses are GCs that host an LMXB. Dashed lines represent the mean g magnitude of the GC in each distance range for the red and blue sample. The dashed lines show a computer cut of the g magnitude at g < 23.5. |
4. Properties of GC-LMXBs
4.1. Optical properties of the host GCs
Because most of previous works that focused on the GC-LMXB connection were restricted to the innermost regions of the galaxies, we verified whether the intra-cluster sample possesses the same properties as its host-galaxy counterpart. As a starting point, we investigated the dependence of the LMXB formation on the host GC luminosity. In Fig. 9 we present the fraction of GC-LMXB as a function of the GC apparent magnitude in the g band for three different galactocentric distances. We note a declining trend in the host-galaxy sample (Reff ≤ 6) as well as in the intra-cluster sample (Reff > 6), suggesting that LMXBs tend to form in bright GCs in both environments. Figure 10 (upper panel) confirms this result by comparing the magnitude distribution of GCs and GC-LMXBs for host-galaxy and intra-cluster sources. In both galactic and intra-cluster cases, a Kolmogorov–Smirnov (K–S) test confirms the difference between the distributions of GCs that hosting an LMXB or are without one at the 99.9% confidence level.
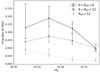 |
Fig. 9. Fraction of GCs hosting LMXBs as a function of luminosity. The different types of lines correspond to different galactocentric distances. The magnitude range is restricted to g ≤ 23.5. The fraction is defined as the number of XGCs divided by the number of GCs in the magnitude bin. The result for the inner region agrees with the results obtained in Paolillo et al. (2011). These authors covered almost the same FoV with HST. |
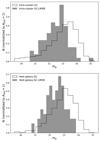 |
Fig. 10. Magnitude distribution of GCs hosting (grey shaded) and GCs without (black line) LMXBs in intra-cluster space (upper panel) and in the host-galaxy environment (lower panel). |
The LMXB formation efficiency was also shown to be dependent on the colour of the host GC (see Sect. 1), with a greater tendency for LMXBs to form in red GCs. To verify whether this trend also holds for intra-cluster GCs, we present in Fig. 11 the g − i colour distribution of intra-cluster and galactic GCs. Again, a K–S test confirms the difference in colour between GCs with and without an LMXB at the 99.9% level in both environments.
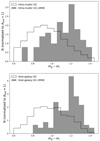 |
Fig. 11. Colour distribution of GCs hosting (grey shaded) and GCs without (black line) LMXBs in intra-cluster space (upper panel) and in the host-galaxy environment (lower panel). |
4.2. X-ray properties of the GC-LMXB
Previous works (Jordán et al. 2004; Kim & Fabbiano 2004; Paolillo et al. 2011) showed that the X-ray properties of LMXBs, such as their X-ray luminosity function, do not depend on the properties of the stellar environment in which they form, such as the colour, magnitude, or density of the host GC. In this section we try to understand if these statements are valid for the intra-cluster population of GC-LMXBs. In order to correct the completeness of our X-ray source catalogue for the variable detection limit across the FoV due to hot gas emission near the brightest galaxies, the variable PSF with off-axis angle, and the different exposure time across the X-ray mosaic, we used the X-ray sensitivity map produced by Jin et al. (2019) to weight X-ray sources according to the fraction of the GCs in which they could have been detected. In Fig. 12 we show the observed and completeness-corrected X-ray luminosity function of the intra-cluster and host-galaxy samples of GC-LMXBs. We found that the completeness-corrected intra-cluster and host-galaxy populations follow a single power law down to Lx ≃ 8.5 × 1037 erg s−13. The intra-cluster sample is more affected by incompleteness because the sensitivity at the edges of the FoV is lower. Fitting the completeness-corrected distributions, we obtain an LF slope of α = 2.04 ± 0.13 for the host-galaxy sample (in agreement with the slopes found in previous works for GC-LMXBs belonging to galaxies, e.g., Kim et al. 2006; Paolillo et al. 2011; Jin et al. 2019), and α = 2.44 ± 0.13 for the intra-cluster sample. This is considerably steeper and consistent with the slope found for field LMXBs in Jin et al. (2019; α = 2.30 ± 0.12) and in previous works (Paolillo et al. 2011). A K–S test confirms the difference of the two completeness-corrected LFs at the 99% confidence level.
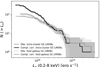 |
Fig. 12. Cumulative X-ray luminosity function for the host-galaxy and intra-cluster sample of GC-LMXBs. The solid lines represent the completeness-corrected LFs, and the dotted lines show the observed LFs. The shaded region represents the 1σ error. |
Then, we studied the Lx distribution by dividing the sample of GC-LMXBs according to the host GC colour (Fig. 13). The completeness-corrected red GC-LMXB follows a power-law distribution with a slope α = 2.37 ± 0.12 down to Lx ≃ 8.5 × 1037 erg s−1. A possible lack of bright LMXBs is observed in the blue systems, which is found to be significant at the ∼2σ (97%) level according to a Poisson statistics. Fitting the entire sample of blue GC-LMXBs down to Lx ≃ 8.5 × 1037 erg s−1 yields α = 2.21 ± 0.18. To further investigate this trend, we separated the red and blue sample into intra-cluster and host-galaxy sources (lower panel of Fig. 13). The population of blue intra-cluster GCs does not host LMXBs above ∼6 × 1038 erg s−1, although again the number of object is small for strong conclusions. The majority of objects above 1039 erg s−1 resides in red GCs possibly because multiple LMXBs reside in a single GC because it is easier to form LMXBs in these systems. However, previous studies often detected variability in systems like this, which argues against this possibility. On the other hand, this high luminosity break has already been observed in literature (Fabbiano 2006, and reference therein) and may reflect the transition between the most massive neutron stars and low-mass black hole systems, suggesting that blue environments are less likely to form binary systems with massive black holes. We point out, however, that considering the small statistics at high Lx, a small contamination by background AGNs randomly matched with GCs could be enough to cause the difference (see below). To verify that this is not linked to the different host GC distribution, we show in Fig. 14 the correlation between Lx and the colour/galactocentric distance of the GCs for the red and blue sample of GC-LMXB. While red GC-LMXB are more centrally concentrated, as discussed before, the brightest sources with LX > 1039 erg s−1 are uniformly distributed throughout the whole distance range. The small number of sources with LX > 1039 erg s−1 does not allow us to draw definitive conclusions, and therefore prevents us from excluding the effect of a background AGN contamination.
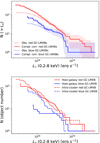 |
Fig. 13. Cumulative X-ray luminosity functions comparison. Upper panel: red and blue sample of GC-LMXB. Lines and shaded areas are represented as in Fig. 12. Lower panel: completeness-corrected luminosity functions for red and blue intra-cluster and host-galaxy sources separately. |
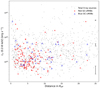 |
Fig. 14. X-ray luminosity as a function of distance from each galaxy. Grey dots represent the whole sample of X-ray sources. Blue triangles and red crosses represent the respective GC-LMXBs. The mean errors in each X-ray luminosity order of magnitude are shown in black. |
We further investigated the spectral properties of the LMXB population through their hardness-ratio (HR), defined as 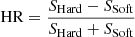 , with Shard the photon flux in the hard band (2–8 KeV) and Ssoft the photon flux in the soft band (0.5–2 Kev). In Fig. 15 we present the HR distribution of host-galaxy and intra-cluster sources. It is readily apparent that intra-cluster GC-LMXBs have harder spectra. A K–S test confirms that the two samples are drawn from different distributions. To understand this trend, we considered whether this systematic difference is related to the LMXB population itself or to their host GCs because we know from Sect. 2.1 and from previous works that the GC population becomes increasingly blue with increasing galactocentric distance (Jordán et al. 2006; D’Abrusco et al. 2016; Cantiello et al. 2018, 2020).
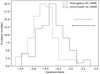 |
Fig. 15. Hardness ratios between host-galaxy (grey) and intra-cluster (black) GC-LMXBs. The error bar is the median value of the errors associated with the HR of the sources. |
In our case, 694 blue GCs (containing 10 LMXBs, i.e. 1.4% of the population) and 618 red GCs (72 LMXBs, i.e. 11.6% of the population) are associated with the main cluster galaxies, while the intra-cluster sample contains 2400 blue GCs (26 LMXBs, i.e. 1.1% of the population) against 1467 red (60 LMXBs, i.e. 4.1% of the population). The number of blue GCs therefore increases in the outer regions. As shown in Fig. 4, we also observe a shift in the average value of the red distribution towards bluer colours, however. In Fig. 16 we show that LMXBs in blue GCs seem to have a harder spectrum than those in red GCs; the result is confirmed when red and blue GC-LMXBs are compared restricted to the intra-cluster sample alone4.
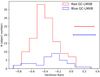 |
Fig. 16. Hardness ratios between red (grey) and blue (black) GC-LMXBs. The error bar is the median value of the errors associated with the HR of the sources. |
To explain this result, we explored three possibilities: (1) Intra-cluster sources are more heavily contaminated by harder-backgound sources than the host-galaxy population. (2) The difference is due to uncertainties in the X-ray spectral response correction, which in turn is due to the combination of the multiple Chandra exposures with different off-axis angles and the presence of diffuse gas, which may affect the background estimate. Finally, (3) the difference is real.
To address the first possibility, we estimated the number of expected contaminants in our FoV. To this end, we used the COSMOS catalogues by Civano et al. (2016) and Laigle et al. (2016) to select X-ray sources within the same X-ray flux limit as was used for the catalogue of Jin et al. (2019), and with optical counterparts obeying the same selection criteria in terms of limiting optical magnitude, colours, and concentration index as we adopted in Sect. 2.1. We predict a contamination of about ten background X-ray sources with optical counterparts over our FoV. In addition, we expect three random superpositions of background sources without optical counterparts, as discussed in Sect. 3. These contaminants do have harder average HR than the bulk of GC-LMXB sources, but they do not account for the entire excess observed in our sample. When we removed the ten hardest sources from the sample of intra-cluster GC-LMXBs, the result was unchanged.
Several factors can affect the derived hardness ratios in the spectral response, including different off-axis angles, detectors (ACIS-I versus ACIS-S), and observing epoch (due to the efficiency degradation of ACIS at low energies with time). We point out, however, that Jin et al. (2019) only used ACIS I0, I1, I2, I3, S2, and S3 chips in order to ensure an optimal source sensitivity. In addition, most intra-cluster sources are still located in the central region of the cluster, although at a greater distance from the main galaxies, and they are covered by multiple observations spanning several years (see Table 1 in Jin et al. 2019). These properties should reduce the potential systematic effects in the X-ray catalogue. To evaluate how the catalogue properties might affect our results, we compared the HR estimates used in this work with the estimate reported in the CSC catalogue. In Fig. 17 we show the HR as a function of the distance from the nearest galaxy for X-ray sources with a counterpart in the CSC master catalogue. We note a difference in the mean HR, mainly driven by host-galaxy sources, both considering GC-LMXBs and field X-ray sources. The higher HR in the CSC is higher on average than the HRs reported in the catalogue used in this work. This suggests that the spectral corrections differ between the two catalogues, possibly due to the different data reduction strategy, source extraction method (see Sect. 2.2), and the treatment of the contribution of the central diffuse emission.
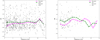 |
Fig. 17. Hardness ratio as a function of the distance for field X-ray objects (left panel) and GC-LMXBs (right panel) with counterparts in the CSC catalogue. Black dots represent the HR estimates in the CSC catalogue, and grey triangles show the HR we used. Dashed green and magenta lines again represent the mean value in each distance bin. |
Concerning the possibility that the observed difference might be real, it is known that the colour mainly depends on metallicity in old GCs, where metal-rich GCs are significantly redder (Cantiello et al. 2018). This might suggest a relation between the spectral properties of LMXBs and the metallicity of the host GC. One model that discusses such a trend was presented by Maccarone et al. (2004), who proposed irradiation-induced winds in metal-poor stars that would cause absorption, mainly of the soft part of the X-ray spectra, which would produce higher HR values. The authors reported this trend for NGC 4472 (Maccarone et al. 2003). In this case Fornax, would be the only other system in which this effect is directly observed so far.
5. Summary and conclusions
We performed an analysis of the properties of LMXBs residing in the population of intra-cluster GCs in the Fornax cluster. The main goal of this work was to study the GC-LMXB connection within the core of the Fornax cluster and its dependence on the environment in terms of galactocentric distance and host GC. For this purpose, we used optical photometry of 5178 candidate GCs from the Fornax Deep Survey (Cantiello et al. 2020). In order to study the possible differences between LMXBs that formed in different GC environments, we performed a Gaussian Mixture Model fit on the g − i colour distribution, finding a separation threshold of g − i ∼ 1.00 between red and blue that agrees with the threshold reported in previous works (D’Abrusco et al. 2016; Cantiello et al. 2020). We obtained 2085 red GCs and 3093 blue GCs. We further observe a tendency in the average g − i colour of becoming bluer with increasing galactocentric distance. Because the GC colours mainly depend on metallicity, this result suggests that the intra-cluster GCs have a lower metallicity on average.
The X-ray data employed in this work were extracted from archival Chandra observations. The source detection procedure together with the extraction of photometry was performed by Jin et al. (2019). In order to study the connection between LMXBs and GCs, we performed a cross-match between the optical and the X-ray catalogues. In this way, we identified 168 X-ray sources that are positionally coincident with GCs. We divided this population into host-galaxy and intra-cluster objects based on their projected distance from the nearest galaxy. We considered as intra-cluster objects the GC-LMXBs within more than 6 Reff from the nearest galaxy and found 82 intra-cluster and 86 host-galaxy GC-LMXBs. Furthermore, considering the colour division performed for the GC sample, we found 36 LMXBs to be associated with blue GCs and 132 LMXBs to be associated with red GCs.
We find the fraction of GC-LMXBs to be dependent on the galactocentric distance; this effect is particularly evident for the red population. Because the GC magnitude seems to be independent of the distance from the galaxies, we conclude that this result may suggest that the LMXBs formation channel in GCs may also depend on the host-galaxy environment. In the past, the evidence for a dependence of the LMXB formation likelihood on the local galaxy environment has been debated (see e.g., Kim et al. 2006 and Paolillo et al. 2011 for an opposing view), but these studies were essentially limited to the inner region of galaxies within a few Reff. Even in this work, there is little evidence for a dependence like this within ∼6 Reff, which is visible only when the analysis is extended to the intra-cluster population. If this is confirmed, the enhanced LMXB formation rate in red GCs might be related to their orbital parameters, as suggested by Puzia et al. (2014), for instance, leading to a stronger influence of the external tidal field. Webb et al. (2016) found that the sizes of red GCs in NGC 1399 are consistent with more radial orbits compared to blue GCs.
We confirm that intra-cluster LMXBs tend to form in red and bright GCs, as has been found for their host-galaxy couterparts. Furthermore, we studied the X-ray properties of the intra-cluster population of GC-LMXB to test whether they are independent of the properties of the host GC as for the host-galaxy sources. We find that the completeness-corrected X-ray luminosity function of the intra-cluster population of GC-LMXBs follows a power law with a slope that is marginally consistent (∼2.2σ) with the slope of the host-galaxy population, and it is consistent with the slope found for field LMXBs in the literature. A Kolmogorov–Smirnov test indicates a statistically significant difference between the LF of the intra-cluster and that of the host-galaxy sample. We cannot confirm any difference between the completeness-corrected LFs of the red and blue populations. We find a lack of bright LMXBs in blue GCs, however, which agrees with what has been found for host-galaxy sources and possibly indicates a lack of black hole binaries in metal-poor systems.
Finally, we observed a puzzling difference in hardness ratio between intra-cluster and host-galaxy GC-LMXBs: the spectra of the intra-cluster sample are harder than those of the host-galaxy sample. Because intra-cluster GCs are bluer on average than the host-galaxy GCs, this result might suggest a relation between HR and the colour of the host GC, and hence the metallicity. We explored different explanations for this difference, including residual systematics in the data and background contamination or a possible physical origin. We found that contamination alone seems unable to explain the observed trend. This result is still tentative, however, and a final conclusion will have to wait for a full spectral analysis of the host-galaxy and intra-cluster GC-LMXB populations.
See the detailed discussion at https://cxc.cfa.harvard.edu/csc/organization.html
This limit yields the best power-law fit according to the algorithm of Newman (2005) as implemented in the R routine powerlaw.R.
Acknowledgments
G.R. acknowledges support from the National Science Centre (UMO-2018/30/E/ST9/00082, UMO-2018/30/M/ST9/00757 and UMO-2020/38/E/ST9/00077). G.D. acknowledges support from FONDECYT REGULAR 1200495, and ANID project Basal FB-210003. This research has made use of data obtained from the Chandra Data Archive and the Chandra Source catalogue, and software provided by the Chandra X-ray Center (CXC) in the application packages CIAO and Sherpa.
References
- Bertin, E., & Arnouts, S. 1996, A&AS, 117, 393 [NASA ADS] [CrossRef] [EDP Sciences] [Google Scholar]
- Blakeslee, J. P., Jordán, A., Mei, S., et al. 2009, ApJ, 694, 556 [Google Scholar]
- Cantiello, M., Capaccioli, M., Napolitano, N., et al. 2015, A&A, 576, A14 [NASA ADS] [CrossRef] [EDP Sciences] [Google Scholar]
- Cantiello, M., D’Abrusco, R., Spavone, M., et al. 2018, A&A, 611, A93 [NASA ADS] [CrossRef] [EDP Sciences] [Google Scholar]
- Cantiello, M., Venhola, A., Grado, A., et al. 2020, A&A, 639, A136 [NASA ADS] [CrossRef] [EDP Sciences] [Google Scholar]
- Capaccioli, M., Spavone, M., Grado, A., et al. 2015, A&A, 581, A10 [NASA ADS] [CrossRef] [EDP Sciences] [Google Scholar]
- Caso, J. P., De Bórtoli, B. J., Ennis, A. I., & Bassino, L. P. 2019, MNRAS, 488, 4504 [NASA ADS] [CrossRef] [Google Scholar]
- Civano, F., Marchesi, S., Comastri, A., et al. 2016, ApJ, 819, 62 [Google Scholar]
- D’Abrusco, R., Cantiello, M., Paolillo, M., et al. 2016, ApJ, 819, L31 [CrossRef] [Google Scholar]
- D’Ago, G., Paolillo, M., Fabbiano, G., et al. 2014, A&A, 567, A2 [NASA ADS] [CrossRef] [EDP Sciences] [Google Scholar]
- Durrell, P. R., Côté, P., Peng, E. W., et al. 2014, ApJ, 794, 103 [NASA ADS] [CrossRef] [Google Scholar]
- Fabbiano, G. 2006, ARA&A, 44, 323 [NASA ADS] [CrossRef] [Google Scholar]
- Ferguson, H. C. 1997, VizieR Online Data Catalog, VII/180 [Google Scholar]
- Forbes, D. A. 2017, MNRAS, 472, L104 [NASA ADS] [CrossRef] [Google Scholar]
- Iodice, E., Capaccioli, M., Grado, A., et al. 2016, ApJ, 820, 42 [Google Scholar]
- Iodice, E., Spavone, M., Capaccioli, M., et al. 2017, ApJ, 839, 21 [Google Scholar]
- Iodice, E., Spavone, M., Capaccioli, M., et al. 2019, A&A, 623, A1 [NASA ADS] [CrossRef] [EDP Sciences] [Google Scholar]
- Jedrzejewski, R. I., Davies, R. L., & Illingworth, G. D. 1987, AJ, 94, 1508 [NASA ADS] [CrossRef] [Google Scholar]
- Jin, X., Hou, M., Zhu, Z., & Li, Z. 2019, ApJ, 876, 53 [NASA ADS] [CrossRef] [Google Scholar]
- Jordán, A., Côté, P., Ferrarese, L., et al. 2004, ApJ, 613, 279 [CrossRef] [Google Scholar]
- Jordán, A., McLaughlin, D. E., Côté, P., et al. 2006, ApJ, 651, L25 [CrossRef] [Google Scholar]
- Jordán, A., Peng, E. W., Blakeslee, J. P., et al. 2015, ApJS, 221, 13 [Google Scholar]
- Kartha, S. S., Forbes, D. A., Spitler, L. R., et al. 2014, MNRAS, 437, 273 [NASA ADS] [CrossRef] [Google Scholar]
- Kim, D.-W., & Fabbiano, G. 2004, ApJ, 611, 846 [NASA ADS] [CrossRef] [Google Scholar]
- Kim, E., Kim, D.-W., Fabbiano, G., et al. 2006, ApJ, 647, 276 [NASA ADS] [CrossRef] [Google Scholar]
- Kim, D. W., Fabbiano, G., Brassington, N. J., et al. 2009, ApJ, 703, 829 [NASA ADS] [CrossRef] [Google Scholar]
- Kim, D. W., Fabbiano, G., Ivanova, N., et al. 2013, ApJ, 764, 98 [NASA ADS] [CrossRef] [Google Scholar]
- Laigle, C., McCracken, H. J., Ilbert, O., et al. 2016, ApJS, 224, 24 [Google Scholar]
- Maccarone, T. J., Kundu, A., & Zepf, S. E. 2003, ApJ, 586, 814 [NASA ADS] [CrossRef] [Google Scholar]
- Maccarone, T. J., Kundu, A., & Zepf, S. E. 2004, ApJ, 606, 430 [NASA ADS] [CrossRef] [Google Scholar]
- Muratov, A. L., & Gnedin, O. Y. 2010, ApJ, 718, 1266 [Google Scholar]
- Newman, M. E. 2005, J. Contemp. Phys., 46, 323 [NASA ADS] [CrossRef] [Google Scholar]
- Paolillo, M., Puzia, T. H., Goudfrooij, P., et al. 2011, ApJ, 736, 90 [NASA ADS] [CrossRef] [Google Scholar]
- Pota, V., Napolitano, N. R., Hilker, M., et al. 2018, MNRAS, 481, 1744 [Google Scholar]
- Prole, D. J., Hilker, M., van der Burg, R. F. J., et al. 2019, MNRAS, 484, 4865 [Google Scholar]
- Puzia, T. H., Paolillo, M., Goudfrooij, P., et al. 2014, ApJ, 786, 78 [Google Scholar]
- Schuberth, Y., Richtler, T., Hilker, M., et al. 2010, A&A, 513, A52 [NASA ADS] [CrossRef] [EDP Sciences] [Google Scholar]
- Stetson, P. B. 1987, PASP, 99, 191 [Google Scholar]
- Venhola, A., Peletier, R., Laurikainen, E., et al. 2019, A&A, 625, A143 [EDP Sciences] [Google Scholar]
- Villegas, D., Jordán, A., Peng, E. W., et al. 2010, ApJ, 717, 603 [Google Scholar]
- Webb, J. J., Sills, A., Harris, W. E., et al. 2016, MNRAS, 460, 2129 [NASA ADS] [CrossRef] [Google Scholar]
All Tables
All Figures
|
Fig. 1. Spatial distribution of the GCs (grey points) and the X-ray sources (red crosses) centred on NGC 1399. The solid black circles represent bright galaxies in the cluster from Ferguson (1997). The size is proportional to their effective radii. The dashed line highlights the FoV of Chandra observations. |
| In the text | |
|
Fig. 2. Luminosity function in g band for the sample of candidate GCs. The dashed black line corresponds to the expected theoretical GC luminosity function (with values μ = 24 and σ = 1.4). |
| In the text | |
|
Fig. 3. g − i colour distribution of GC candidates in the central square degree of the Fornax cluster. The smooth solid black, red, and blue lines show the GMM model for the total, red, and blue populations. |
| In the text | |
|
Fig. 4. Mean values calculated by the GMM for different distances from each galaxy in terms of Reff for red and blue GCs, and the separation performed by the GMM. The error bars correspond to the standard deviation of the mean. |
| In the text | |
|
Fig. 5. Cumulative X-ray luminosity function for the sources from the catalogue of Jin et al. (2019) and for the CSC catalogue. The shaded region represents the 1σ error. |
| In the text | |
|
Fig. 6. Spatial distribution of intra-cluster (cyan crosses) and host-galaxy (magenta crosses) GC-LMXBs. Cluster galaxies are the solid black circles, and the sizes are proportional to their effective radii. The dashed circle shows the 6 Reff distance from the galaxy centre. The dashed line depicts the FoV of the Chandra observations. |
| In the text | |
|
Fig. 7. Fraction of XGC as a function of the distance in units of Reff for the total, red, and blue sample of GCs. The fraction is defined as the number of total, red, or blue XGC divided by the respective total number of GCs in the distance bin. The distances on the X-axis are from the nearest galaxy to the object. |
| In the text | |
|
Fig. 8. Magnitude in g band as a function of the distance in terms of Reff. Grey circles and triangles represent red and blue GCs, respectively. Black crosses are GCs that host an LMXB. Dashed lines represent the mean g magnitude of the GC in each distance range for the red and blue sample. The dashed lines show a computer cut of the g magnitude at g < 23.5. |
| In the text | |
|
Fig. 9. Fraction of GCs hosting LMXBs as a function of luminosity. The different types of lines correspond to different galactocentric distances. The magnitude range is restricted to g ≤ 23.5. The fraction is defined as the number of XGCs divided by the number of GCs in the magnitude bin. The result for the inner region agrees with the results obtained in Paolillo et al. (2011). These authors covered almost the same FoV with HST. |
| In the text | |
|
Fig. 10. Magnitude distribution of GCs hosting (grey shaded) and GCs without (black line) LMXBs in intra-cluster space (upper panel) and in the host-galaxy environment (lower panel). |
| In the text | |
|
Fig. 11. Colour distribution of GCs hosting (grey shaded) and GCs without (black line) LMXBs in intra-cluster space (upper panel) and in the host-galaxy environment (lower panel). |
| In the text | |
|
Fig. 12. Cumulative X-ray luminosity function for the host-galaxy and intra-cluster sample of GC-LMXBs. The solid lines represent the completeness-corrected LFs, and the dotted lines show the observed LFs. The shaded region represents the 1σ error. |
| In the text | |
|
Fig. 13. Cumulative X-ray luminosity functions comparison. Upper panel: red and blue sample of GC-LMXB. Lines and shaded areas are represented as in Fig. 12. Lower panel: completeness-corrected luminosity functions for red and blue intra-cluster and host-galaxy sources separately. |
| In the text | |
|
Fig. 14. X-ray luminosity as a function of distance from each galaxy. Grey dots represent the whole sample of X-ray sources. Blue triangles and red crosses represent the respective GC-LMXBs. The mean errors in each X-ray luminosity order of magnitude are shown in black. |
| In the text | |
|
Fig. 15. Hardness ratios between host-galaxy (grey) and intra-cluster (black) GC-LMXBs. The error bar is the median value of the errors associated with the HR of the sources. |
| In the text | |
|
Fig. 16. Hardness ratios between red (grey) and blue (black) GC-LMXBs. The error bar is the median value of the errors associated with the HR of the sources. |
| In the text | |
|
Fig. 17. Hardness ratio as a function of the distance for field X-ray objects (left panel) and GC-LMXBs (right panel) with counterparts in the CSC catalogue. Black dots represent the HR estimates in the CSC catalogue, and grey triangles show the HR we used. Dashed green and magenta lines again represent the mean value in each distance bin. |
| In the text | |
Current usage metrics show cumulative count of Article Views (full-text article views including HTML views, PDF and ePub downloads, according to the available data) and Abstracts Views on Vision4Press platform.
Data correspond to usage on the plateform after 2015. The current usage metrics is available 48-96 hours after online publication and is updated daily on week days.
Initial download of the metrics may take a while.