Open Access
Fig. 13.
Download original image
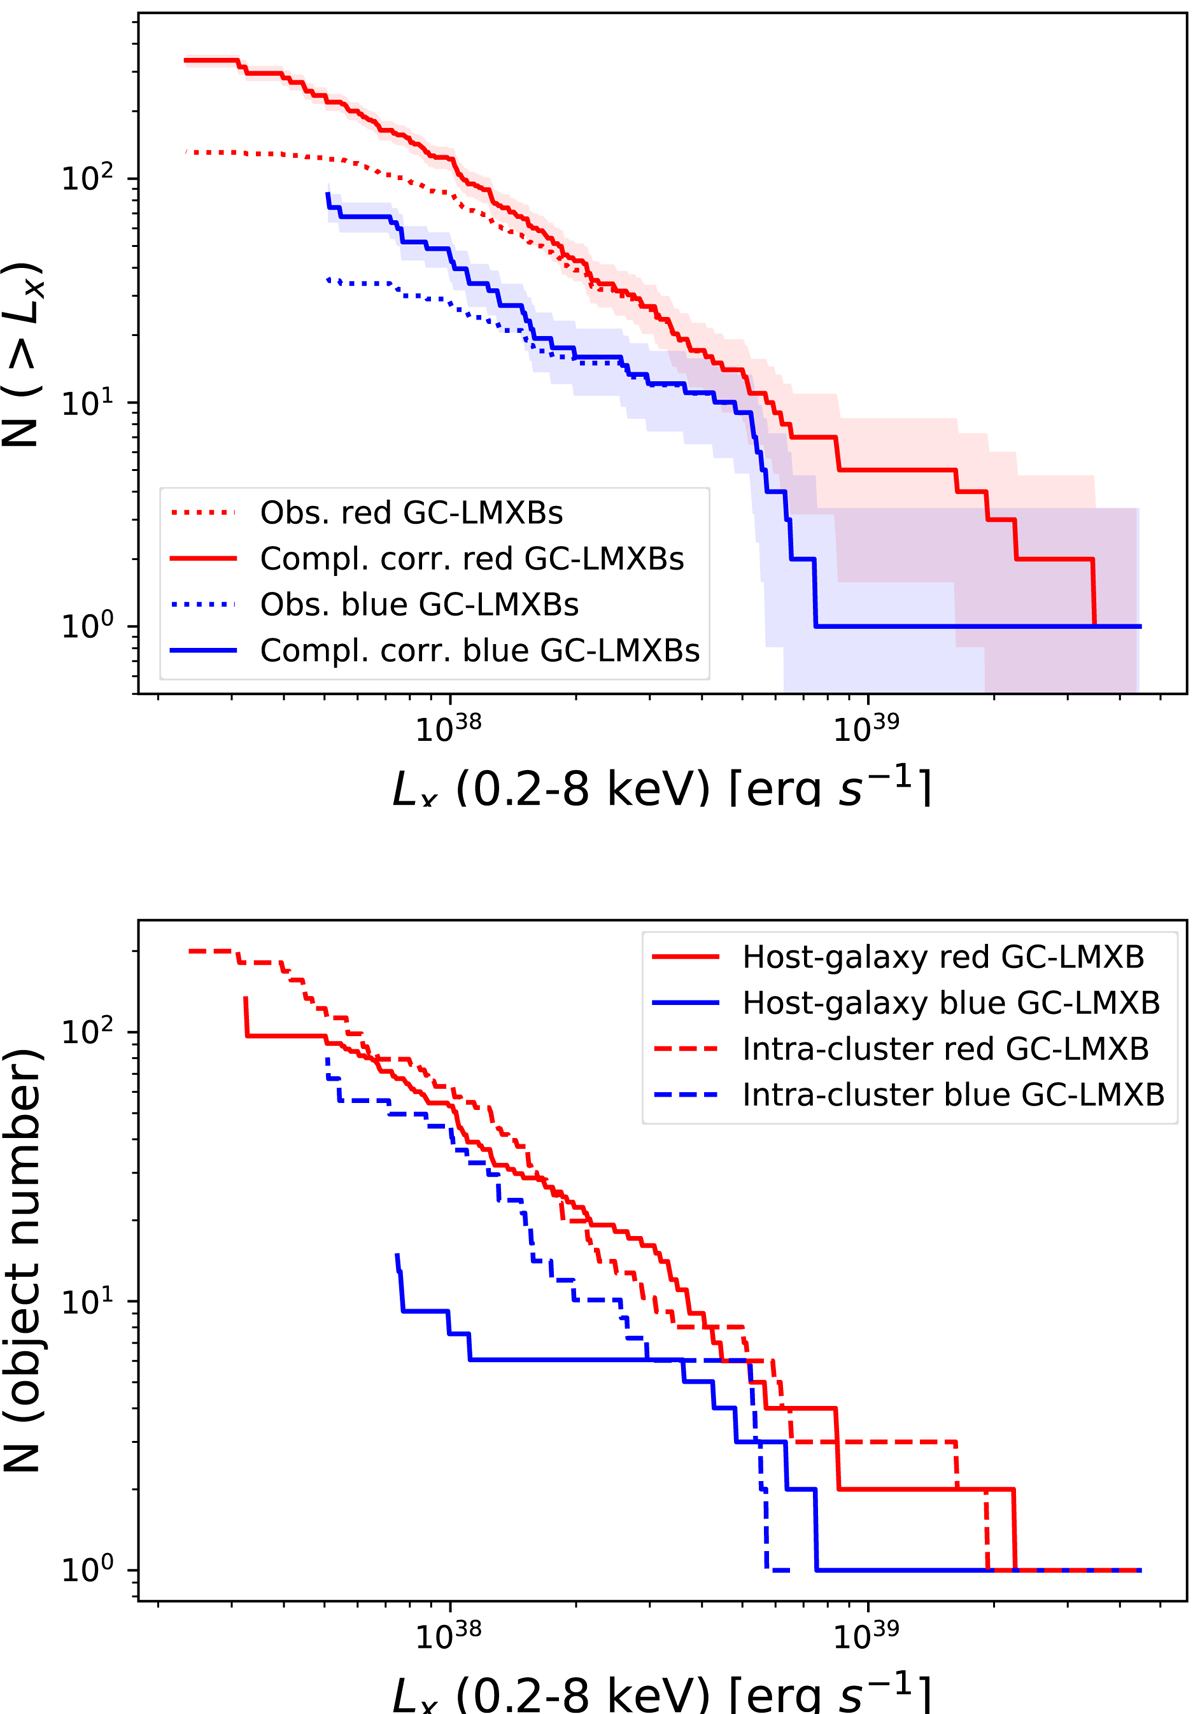
Cumulative X-ray luminosity functions comparison. Upper panel: red and blue sample of GC-LMXB. Lines and shaded areas are represented as in Fig. 12. Lower panel: completeness-corrected luminosity functions for red and blue intra-cluster and host-galaxy sources separately.
Current usage metrics show cumulative count of Article Views (full-text article views including HTML views, PDF and ePub downloads, according to the available data) and Abstracts Views on Vision4Press platform.
Data correspond to usage on the plateform after 2015. The current usage metrics is available 48-96 hours after online publication and is updated daily on week days.
Initial download of the metrics may take a while.