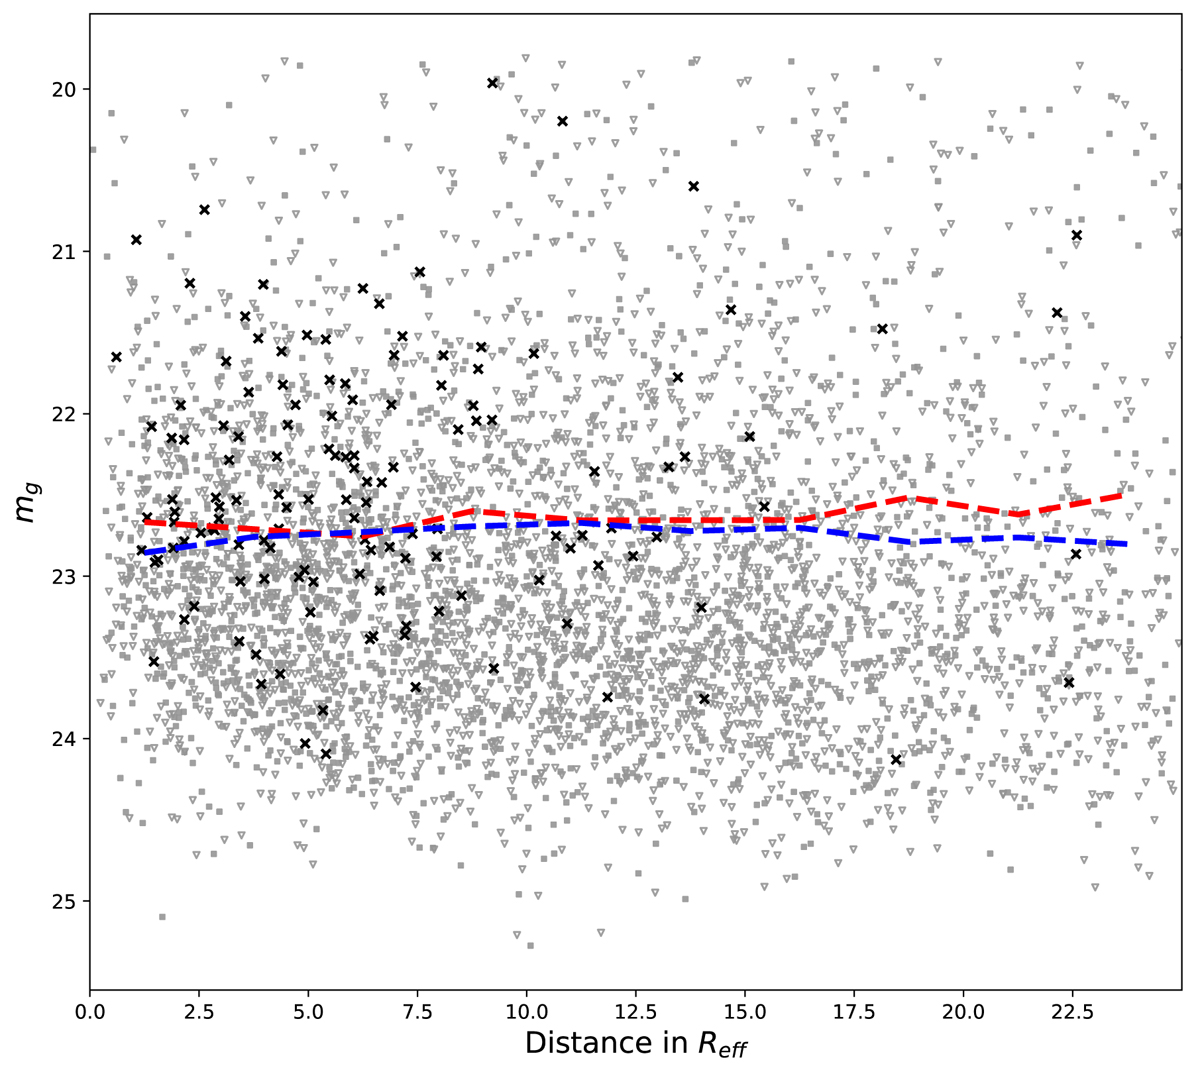
Fig. 8.
Download original image
Magnitude in g band as a function of the distance in terms of Reff. Grey circles and triangles represent red and blue GCs, respectively. Black crosses are GCs that host an LMXB. Dashed lines represent the mean g magnitude of the GC in each distance range for the red and blue sample. The dashed lines show a computer cut of the g magnitude at g < 23.5.
Current usage metrics show cumulative count of Article Views (full-text article views including HTML views, PDF and ePub downloads, according to the available data) and Abstracts Views on Vision4Press platform.
Data correspond to usage on the plateform after 2015. The current usage metrics is available 48-96 hours after online publication and is updated daily on week days.
Initial download of the metrics may take a while.