Fig. 6.

Download original image
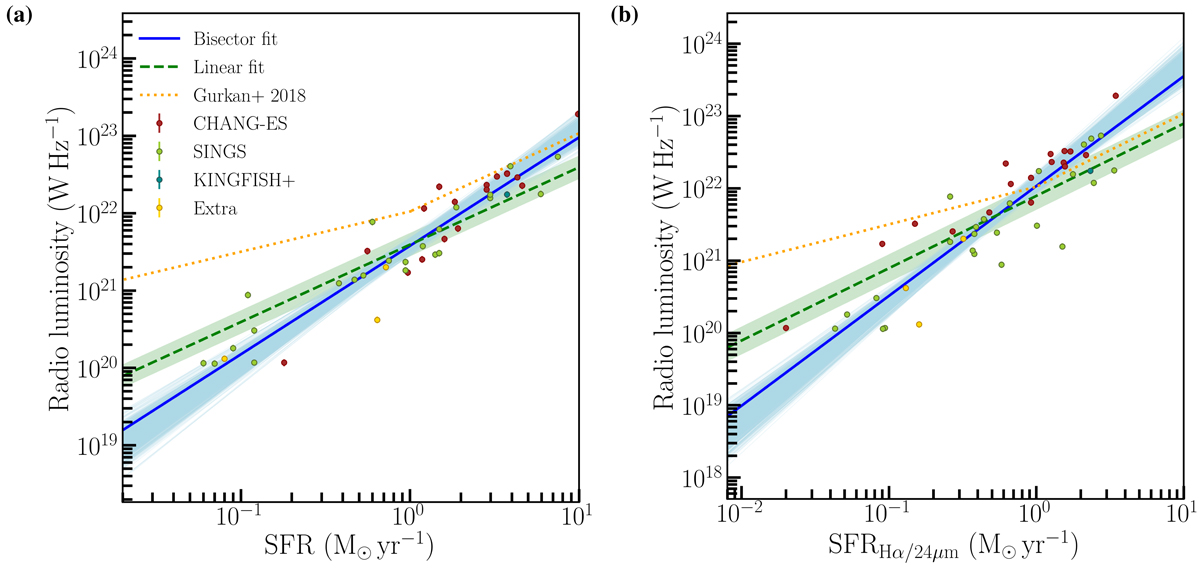
Integrated radio–SFR relation at 144 MHz. Blue lines indicate the best-fitting relations using a bisector fitting method as fitted in the log–log space. The dashed green line shows the best-fitting linear relation as fitted in linear space. Shaded bands represent the 3σ confidence intervals from the 1000 Monte–Carlo realisations. Panel a: the SFR is calculated from the TIR luminosity; in the panel b: the SFR is calculated using either the hybrid Hα + 24 μm SFR calibration or a 24 μm only calibration. For both SFR calibrations, the radio–SFR relation is clearly non-linear.
Current usage metrics show cumulative count of Article Views (full-text article views including HTML views, PDF and ePub downloads, according to the available data) and Abstracts Views on Vision4Press platform.
Data correspond to usage on the plateform after 2015. The current usage metrics is available 48-96 hours after online publication and is updated daily on week days.
Initial download of the metrics may take a while.


