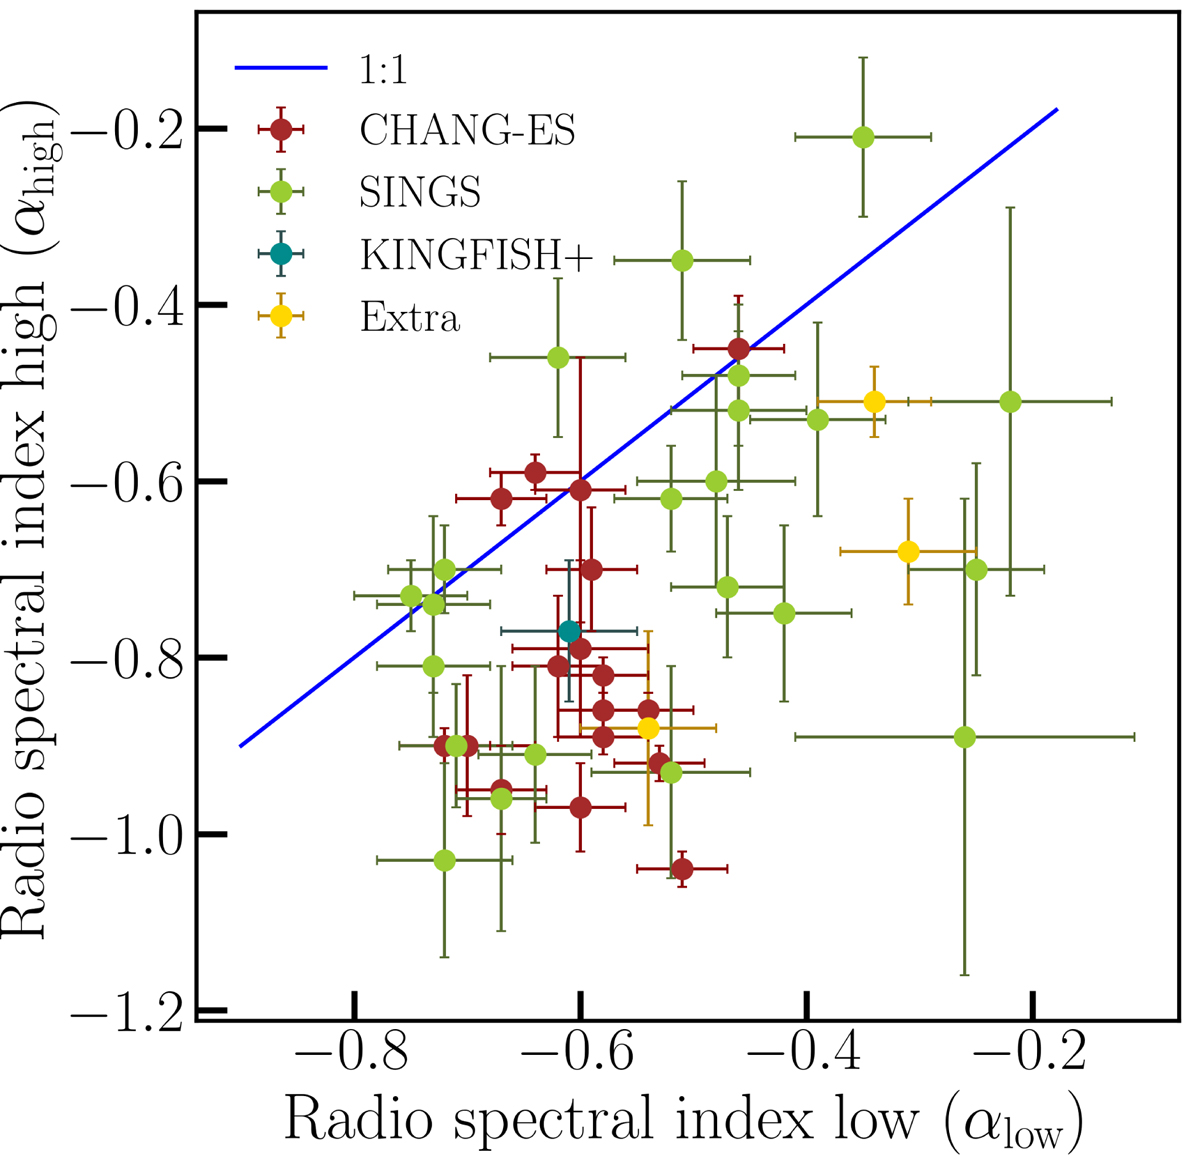
Fig. 3.

Download original image
Radio colour–colour diagram with a comparison of the high-frequency radio spectral index αhigh (1400–5000 MHz) with the low-frequency radio spectral index αlow (144–1400 MHz) taken from Table 2. The blue solid line indicates points of equal spectral index, indicating a power-law radio continuum spectrum. Most of the data points lie below the blue line indicating spectra with a convex curvature. Data points above the blue line indicate concave spectra, as may be explained by a higher thermal fraction at high frequencies.
Current usage metrics show cumulative count of Article Views (full-text article views including HTML views, PDF and ePub downloads, according to the available data) and Abstracts Views on Vision4Press platform.
Data correspond to usage on the plateform after 2015. The current usage metrics is available 48-96 hours after online publication and is updated daily on week days.
Initial download of the metrics may take a while.


