Fig. B.17.

Download original image
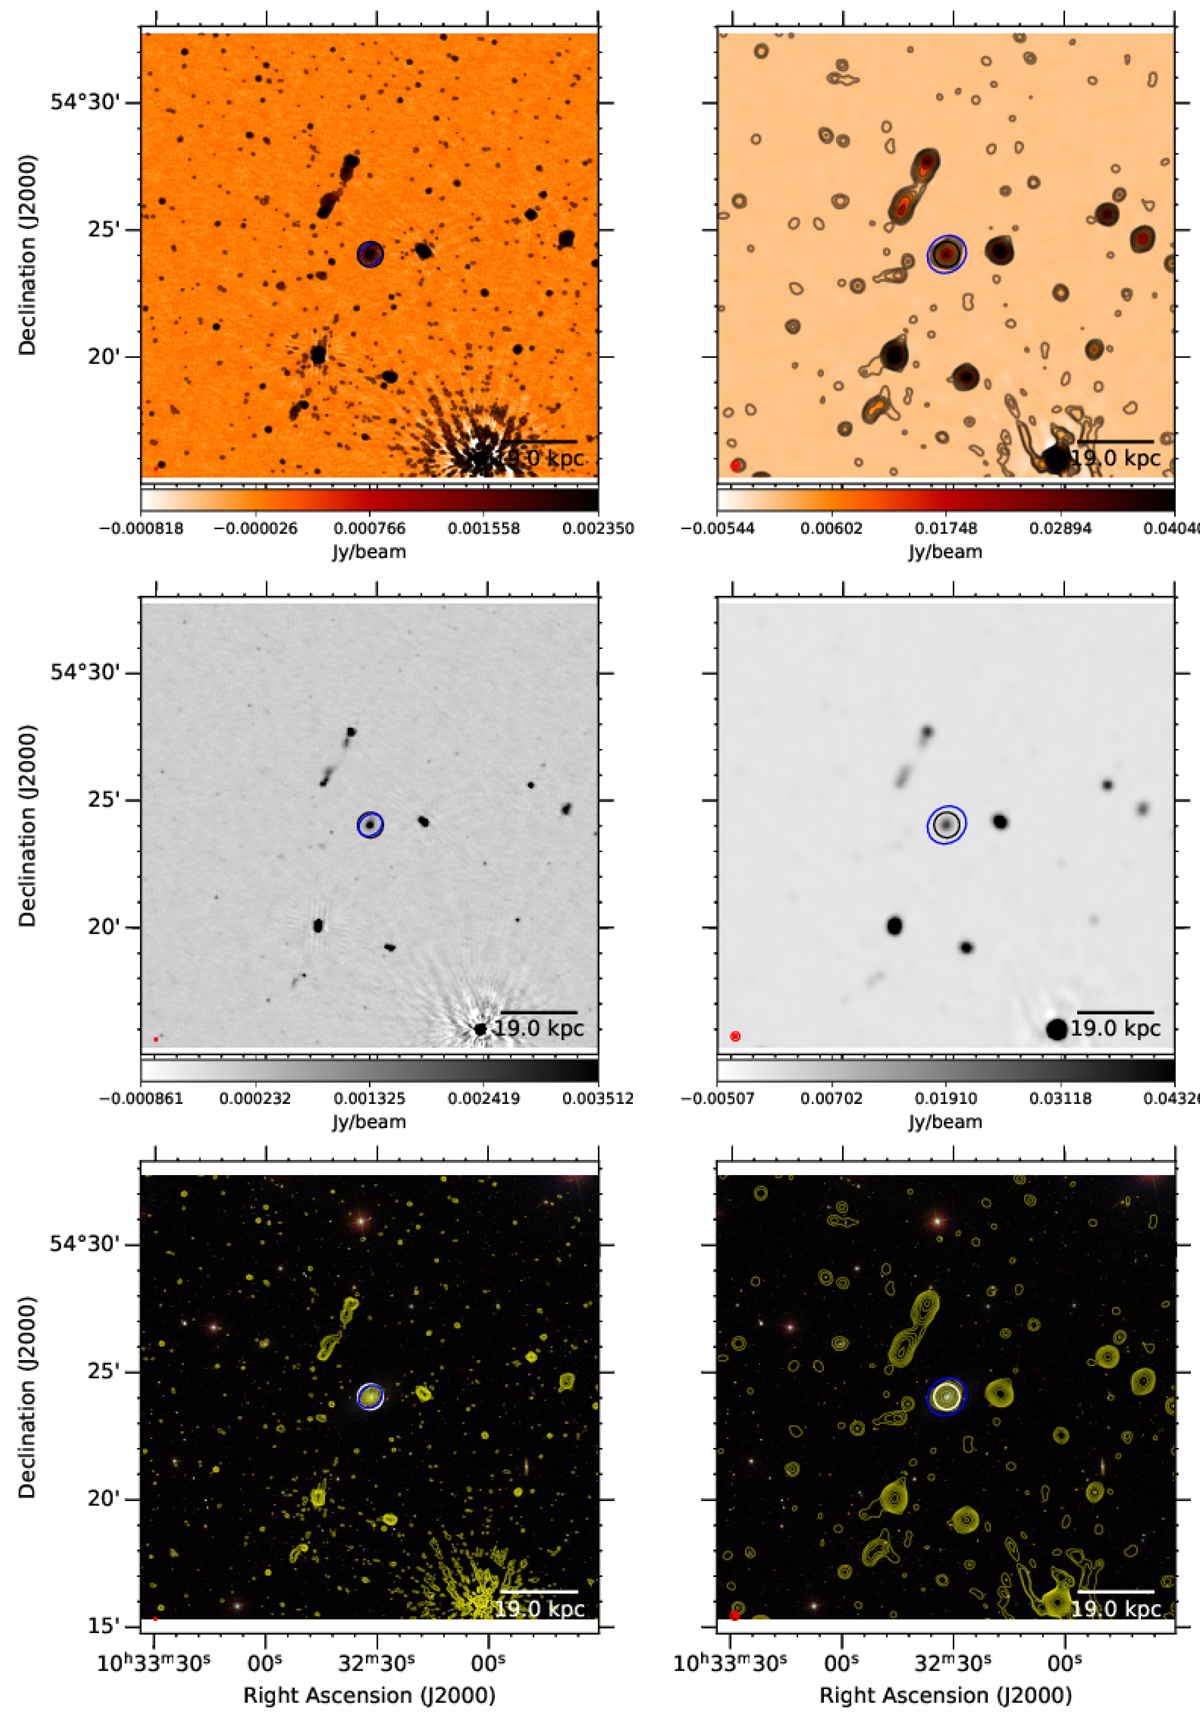
Mrk 33. The first row shows from left to right the 144-MHz maps at 6 and 20 arcsec resolution, respectively. Contours start at 3σ with with increments of a power of two. The black circle shows the optical D25 diameter and the blue ellipses show the 3σ contour extent used to integrate the flux density. The second row shows again the 6 and 20-arcsec images without contours. The third row shows the 6- and 20-arcsec contours overlayed on an rgb SDSS image. The filled circle in the bottom-left corner shows the synthesised beam. A scale bar shows the projected size at the distance of the galaxy.
Current usage metrics show cumulative count of Article Views (full-text article views including HTML views, PDF and ePub downloads, according to the available data) and Abstracts Views on Vision4Press platform.
Data correspond to usage on the plateform after 2015. The current usage metrics is available 48-96 hours after online publication and is updated daily on week days.
Initial download of the metrics may take a while.


