Fig. 6
Download original image
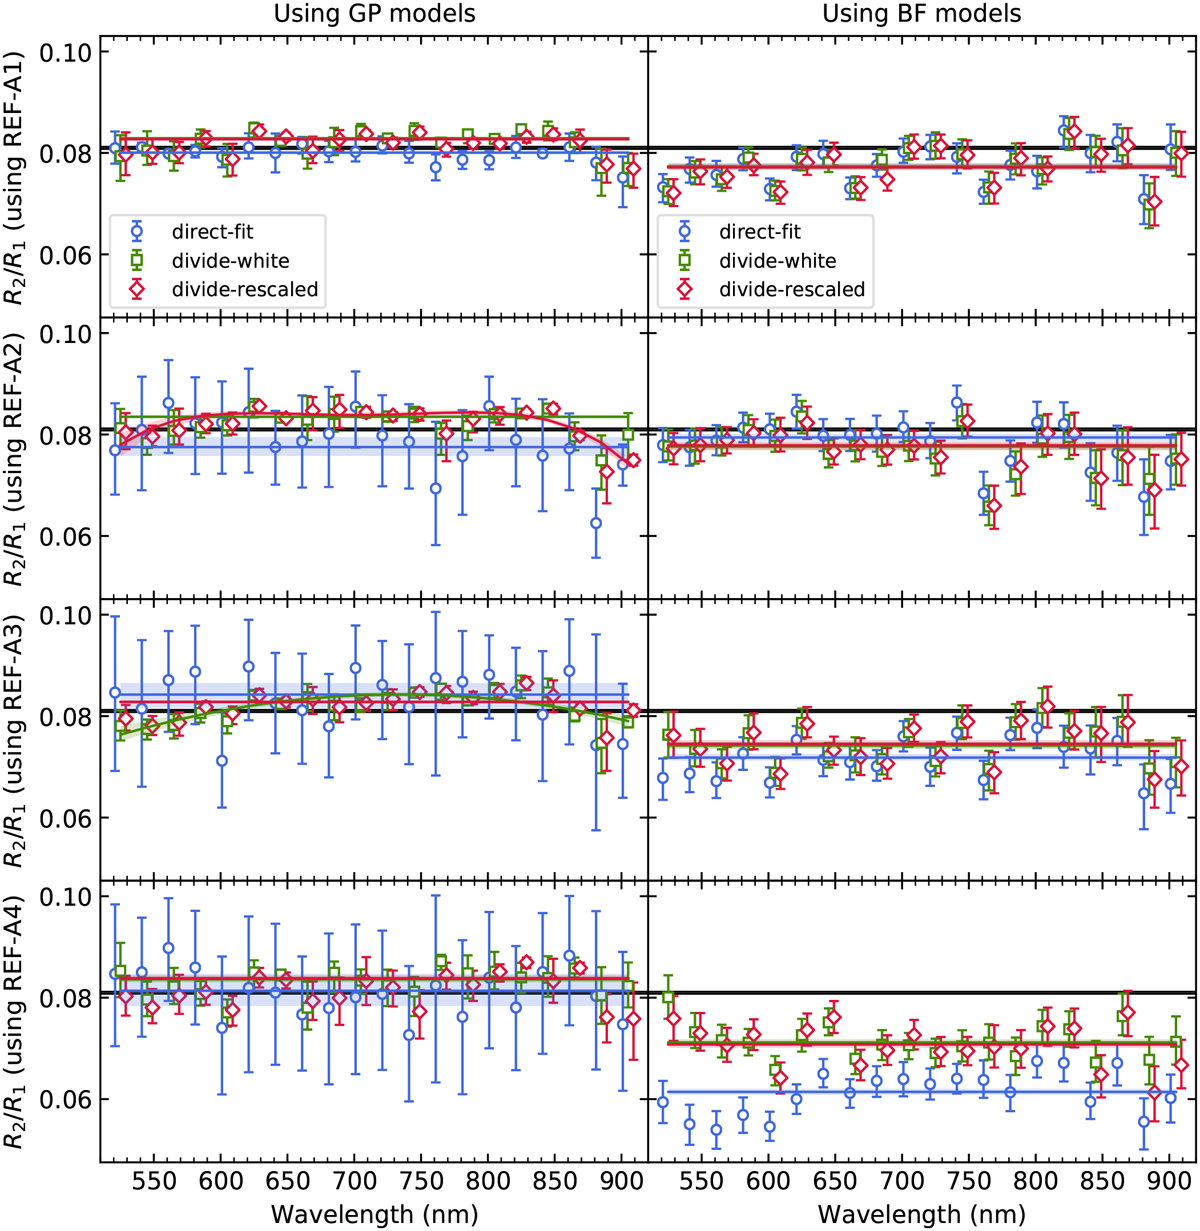
Transmission spectra of KIC 10657664B calculated using different noise models (left column: GP-M32 model. Right column: best-fit BF model), different reference stars (REF-A1 to A4 from the top row to the bottom row), and different common-mode removal techniques (direct-fit: blue circles; divide-white: green squares; divide-rescaled: red diamonds). The solid lines and shaded areas are the best-fit polynomials with the strongest Bayesian evidence and their 1er credible intervals, respectively. The black horizontal lines are the broadband radius ratio from the Kepler data. The data points are slightly shifted along the wavelength for clarity.
Current usage metrics show cumulative count of Article Views (full-text article views including HTML views, PDF and ePub downloads, according to the available data) and Abstracts Views on Vision4Press platform.
Data correspond to usage on the plateform after 2015. The current usage metrics is available 48-96 hours after online publication and is updated daily on week days.
Initial download of the metrics may take a while.