Fig. 3
Download original image
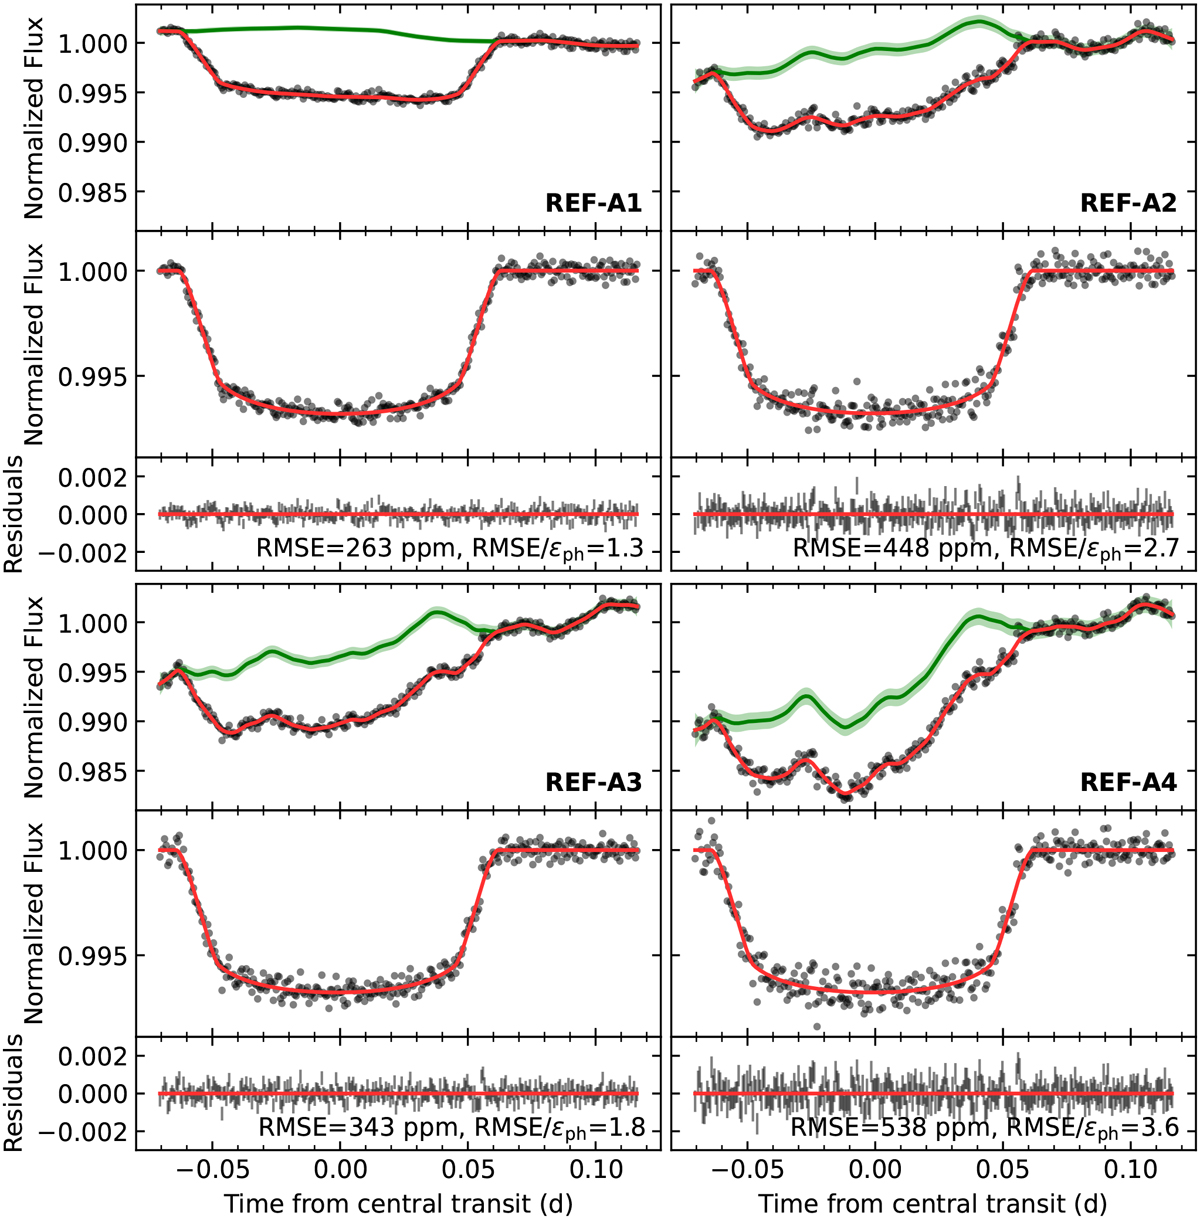
Results of white-light curve fitting for KIC 10657664 using the GP-M32 model. The four split parts correspond to the light curves calibrated with four reference stars (REF-A1 to A4). In each part, the top panel shows the white-light curve (black dots), the best-fit model (red), and the GP systematics (green), the middle panel shows the detrended light curve (black dots) and the transit model (red), and the bottom panel shows the residuals, where εph denotes the uncertainty of photon-dominated noise. The green shaded intervals indicate 5σ confidence of the GP models. The GP systematics are shifted to match the light-curve baselines.
Current usage metrics show cumulative count of Article Views (full-text article views including HTML views, PDF and ePub downloads, according to the available data) and Abstracts Views on Vision4Press platform.
Data correspond to usage on the plateform after 2015. The current usage metrics is available 48-96 hours after online publication and is updated daily on week days.
Initial download of the metrics may take a while.