Fig. A.2
Download original image
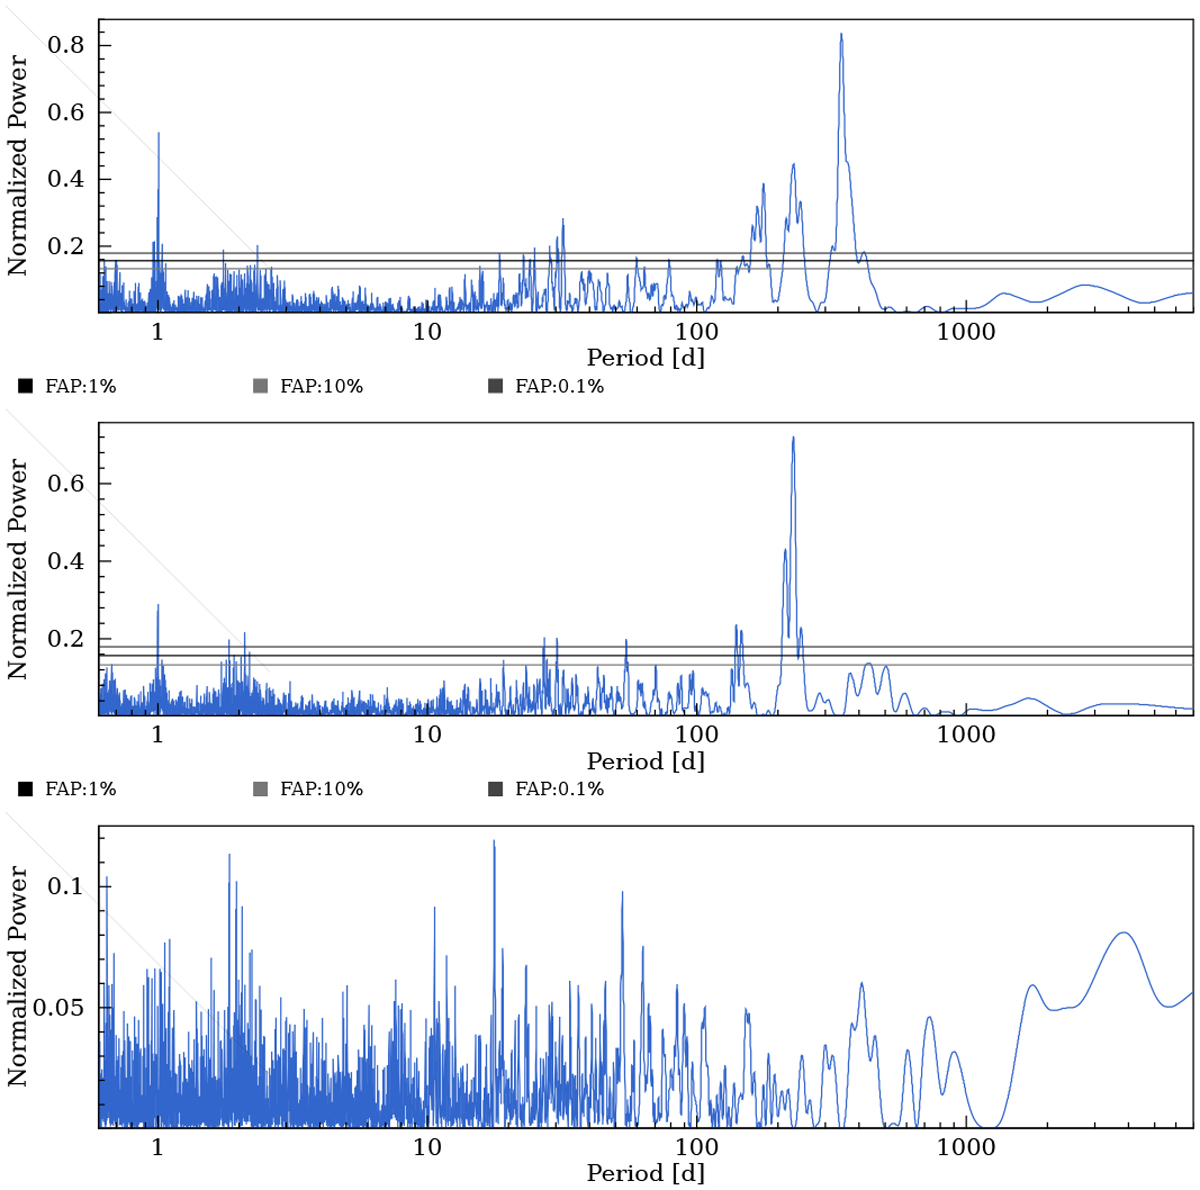
HD 45364: Periodograms of the RV time series. The three horizontal lines correspond to different levels of false alarm probability (FAP) of 10%, 1%, and 0.1% from bottom to top. Top: Periodogram of the RV time series with no Keplerian in the model. The highest peak is very significant and corresponds to a signal of period 344.03 days. Middle : Periodogram of the residuals after subtraction of that signal, modelled with a Keplerian. Another highly significant signal is detected at a period = 227.69 days. Bottom: Periodogram of the residuals after subtraction of the two-keplerian model.
Current usage metrics show cumulative count of Article Views (full-text article views including HTML views, PDF and ePub downloads, according to the available data) and Abstracts Views on Vision4Press platform.
Data correspond to usage on the plateform after 2015. The current usage metrics is available 48-96 hours after online publication and is updated daily on week days.
Initial download of the metrics may take a while.