Open Access
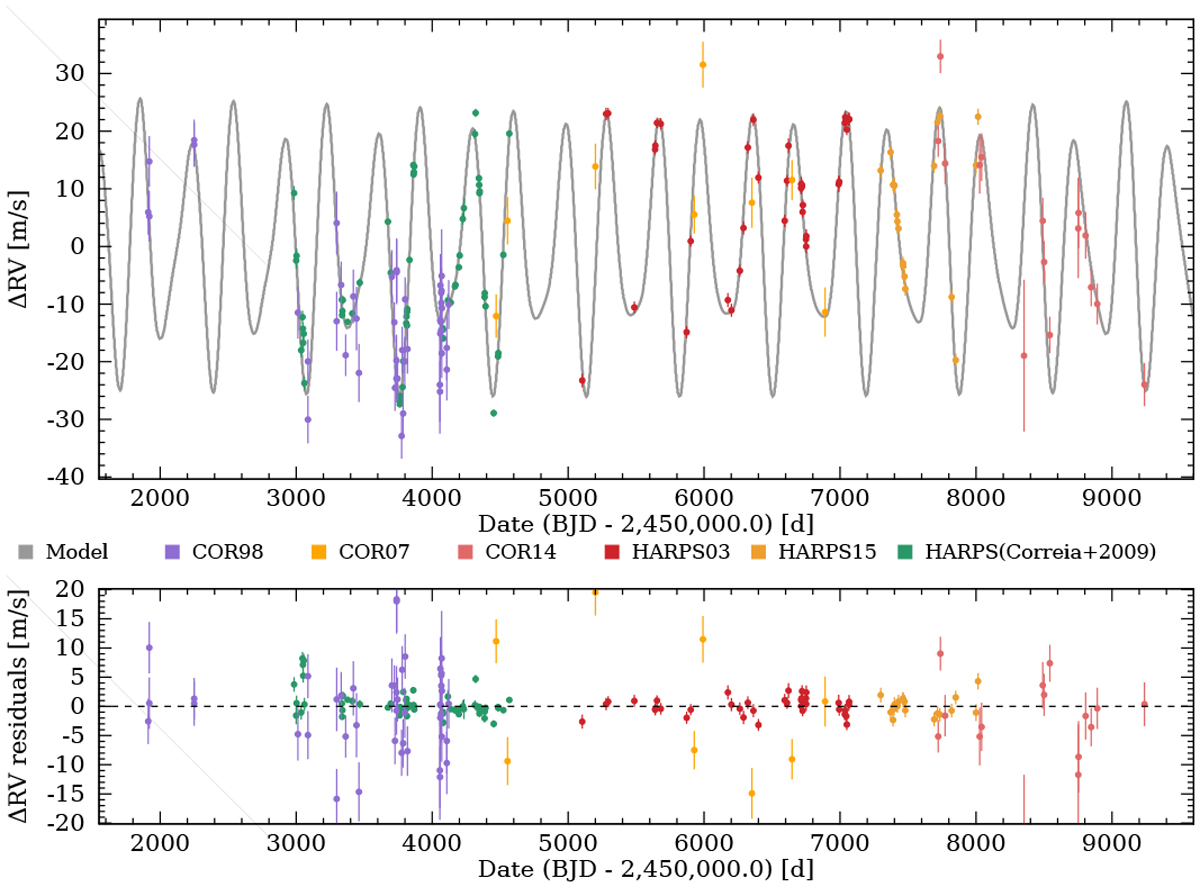
Fig. A.1
Download original image
HD 45364: Full RV time series containing the previously published HARPS data (in green), the additional HARPS data gathered after 2009 (HARPS03 and HARPS15), and the CORALIE data covering 20 years of observations (COR98, COR07 and COR14). Finally, the grey curve presents the bestfit of the two-Keplerian model.
Current usage metrics show cumulative count of Article Views (full-text article views including HTML views, PDF and ePub downloads, according to the available data) and Abstracts Views on Vision4Press platform.
Data correspond to usage on the plateform after 2015. The current usage metrics is available 48-96 hours after online publication and is updated daily on week days.
Initial download of the metrics may take a while.