Fig. 3
Download original image
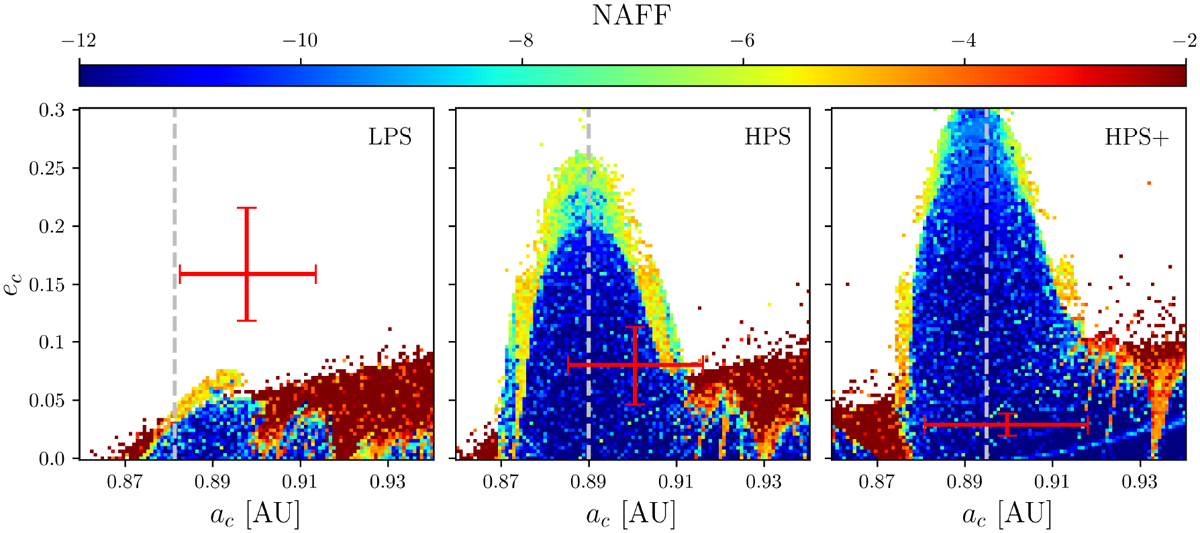
HD 45364: chaos maps around the 3:2 MMR in the subspace (ac,ec) for each set of RV measurements. The red crosses represent the 1σ dispersion around the median value of the MCMC posterior distribution for both ac and ec. The vertical dashed lines depict the location of the commensurability of the periods (Pc/Pb = 3/2), which changes from one map to another with different estimations of Pb. The colour code depicts the NAFF chaos level, while the squares are coloured white if the corresponding configurations did not reach the end of the simulation (either because of a close encounter or an escape). From left to right: LPS, HPS, and HPS+ datasets.
Current usage metrics show cumulative count of Article Views (full-text article views including HTML views, PDF and ePub downloads, according to the available data) and Abstracts Views on Vision4Press platform.
Data correspond to usage on the plateform after 2015. The current usage metrics is available 48-96 hours after online publication and is updated daily on week days.
Initial download of the metrics may take a while.