Open Access
Fig. 1
Download original image
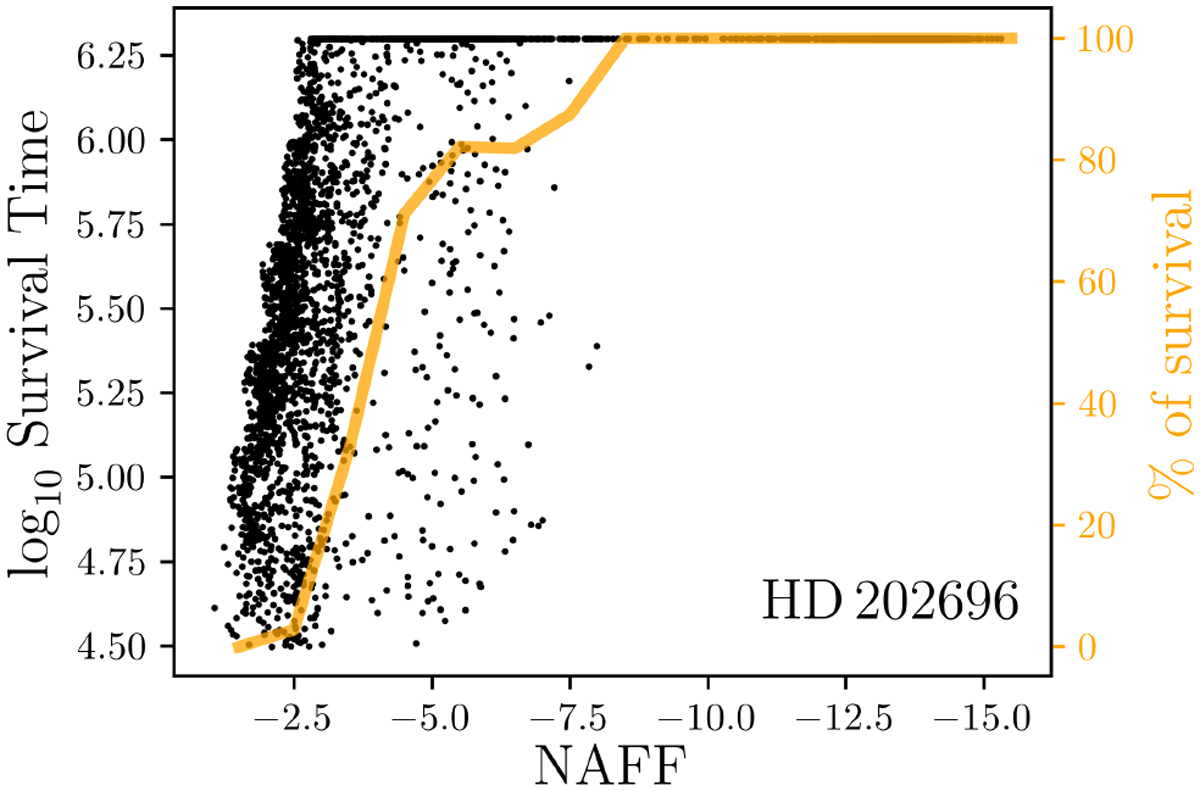
HD 202696. Black: scatter plot of the NAFF chaos indicator with respect to the actual survival time of the system configurations. Orange: proportion of stable systems (i.e. that survived the entire 2 Myr of integration) for consecutive ranges of NAFF.
Current usage metrics show cumulative count of Article Views (full-text article views including HTML views, PDF and ePub downloads, according to the available data) and Abstracts Views on Vision4Press platform.
Data correspond to usage on the plateform after 2015. The current usage metrics is available 48-96 hours after online publication and is updated daily on week days.
Initial download of the metrics may take a while.