Fig. 6
Download original image
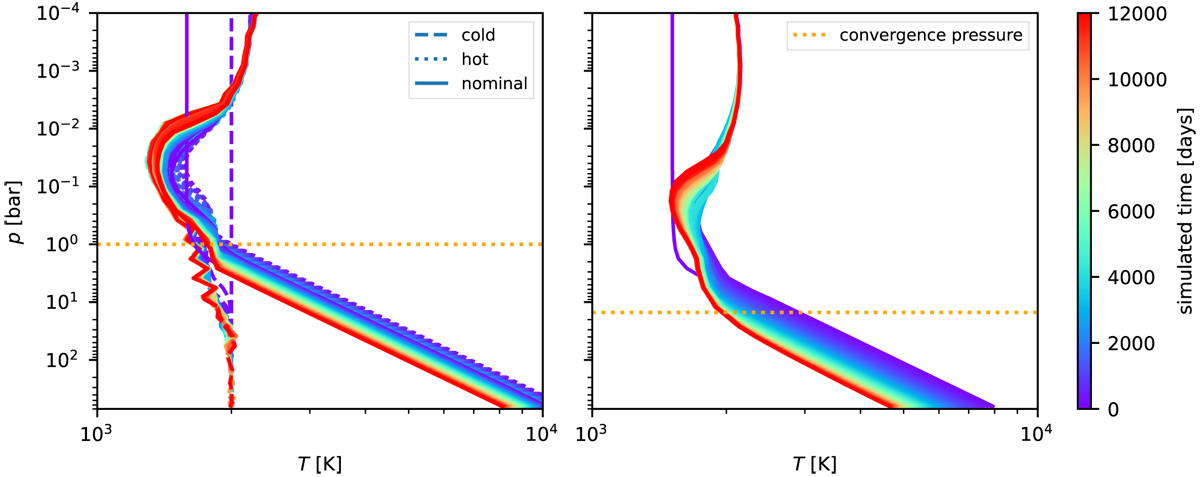
Evolution of the temperature profile at the substellar point for HD 209458b (left) and WASP-43b (right). Left panel: includes the evolution of two additional HD 209458b simulations with a colder and a hotter initial temperature profile. Right panel: includes one additional WASP-43b simulation with a cooler initial temperature profile. The additional simulations initialized with an adiabat ran for 3000 days, whereas the cool HD 209458b ran for 5000 days. The temperature time averaging and output interval is set to 100 days, therefore not resolving the fast semi-convergence of the temperature in the photosphere during the first 100 days. The horizontal orange dashed line illustrates the approximate altitude at which radiative heating or cooling becomes very small.
Current usage metrics show cumulative count of Article Views (full-text article views including HTML views, PDF and ePub downloads, according to the available data) and Abstracts Views on Vision4Press platform.
Data correspond to usage on the plateform after 2015. The current usage metrics is available 48-96 hours after online publication and is updated daily on week days.
Initial download of the metrics may take a while.