Free Access
Fig. B.2
Download original image
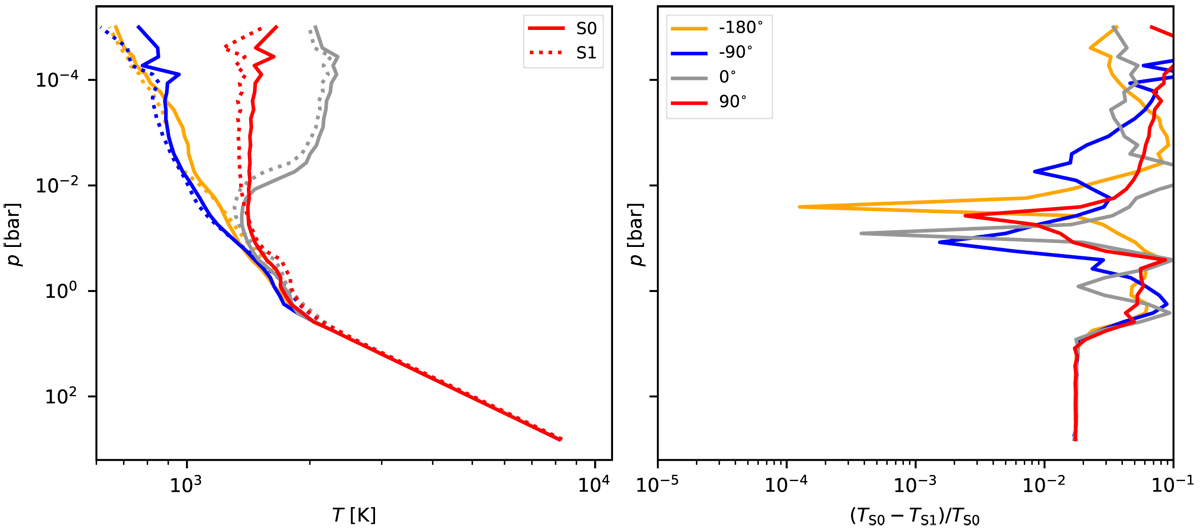
Additional test demonstrating the performance of SO vs S1 by looking at the final temperature differences (at 12000 days) for several longitudes. The S1 simulation is initialized at 10000 days using the state of the nominal SO simulation.
Current usage metrics show cumulative count of Article Views (full-text article views including HTML views, PDF and ePub downloads, according to the available data) and Abstracts Views on Vision4Press platform.
Data correspond to usage on the plateform after 2015. The current usage metrics is available 48-96 hours after online publication and is updated daily on week days.
Initial download of the metrics may take a while.