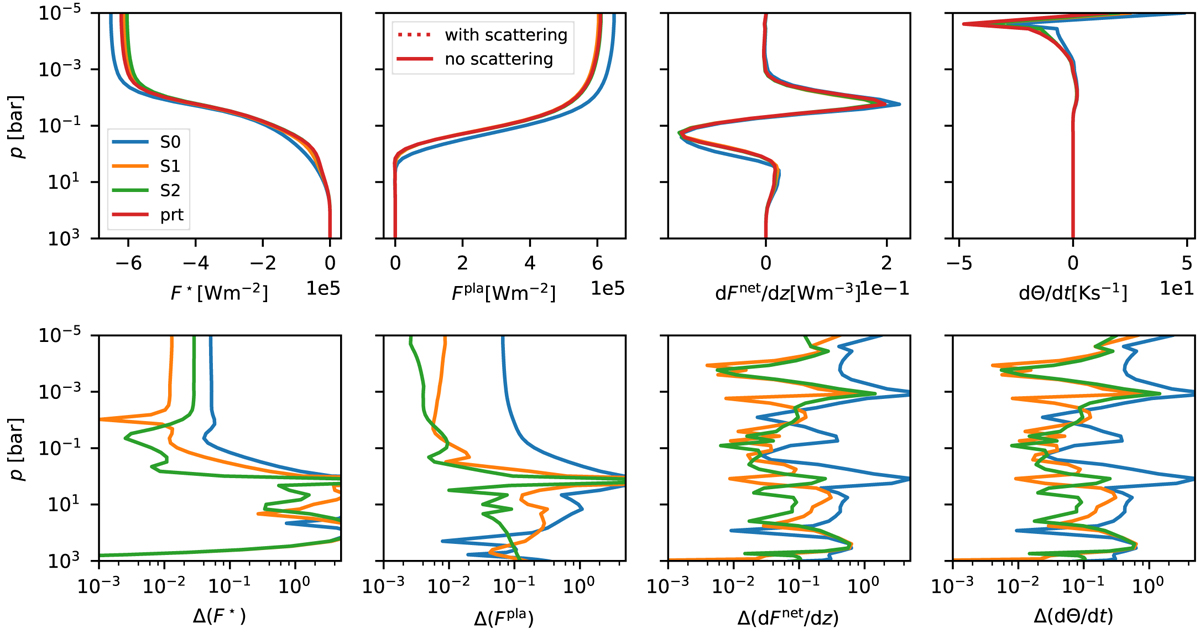
Fig. B.1
Download original image
Test 3 of Amundsen et al. (2014) for a mixed dayside hot Jupiter atmosphere, where we compare fluxes and heating rates for different wavelength resolutions (see Table 3) in expeRT/MITgcm (SO, S1, S2) to petitRADTRANS (prt). The bottom panels display the residuals of the above panels. From left to right, we show the incoming stellar flux, the emitting planetary flux, the gradient of the net flux, and the resulting change of potential temperature.
Current usage metrics show cumulative count of Article Views (full-text article views including HTML views, PDF and ePub downloads, according to the available data) and Abstracts Views on Vision4Press platform.
Data correspond to usage on the plateform after 2015. The current usage metrics is available 48-96 hours after online publication and is updated daily on week days.
Initial download of the metrics may take a while.