Fig. 1
Download original image
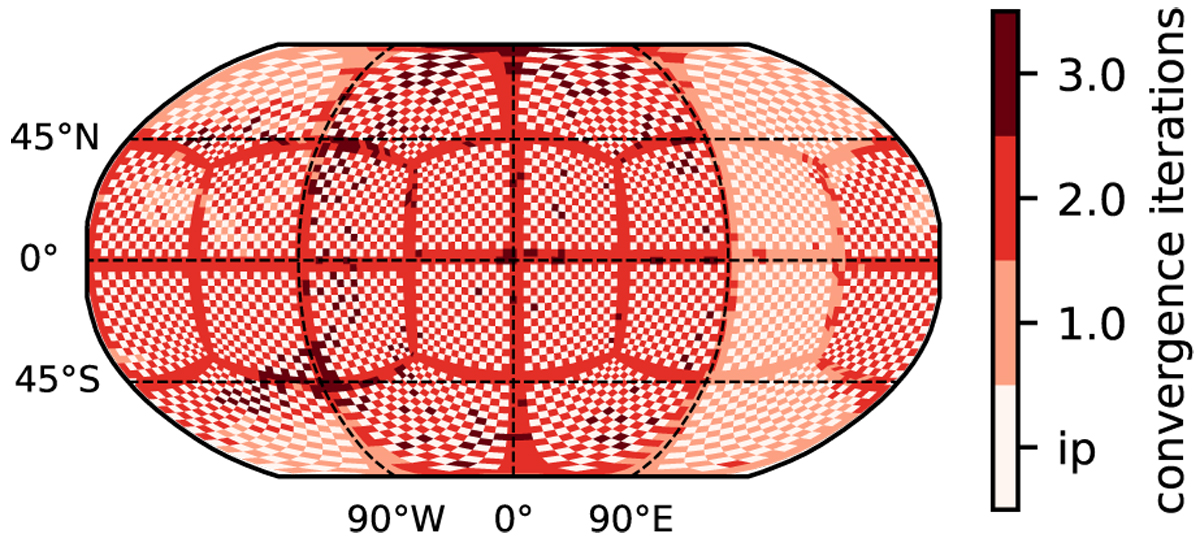
Horizontal map displaying the number of iterations to converge the source function (Eq. (11)) during runtime (at t = 12000 d) for the HD 209458b simulation. The interpolated cells (ip) are staggered to each other. The C32 grid divides the horizontal domain into 24 individual computational domains, as seen by the line structure.
Current usage metrics show cumulative count of Article Views (full-text article views including HTML views, PDF and ePub downloads, according to the available data) and Abstracts Views on Vision4Press platform.
Data correspond to usage on the plateform after 2015. The current usage metrics is available 48-96 hours after online publication and is updated daily on week days.
Initial download of the metrics may take a while.