Fig. 9.
Download original image
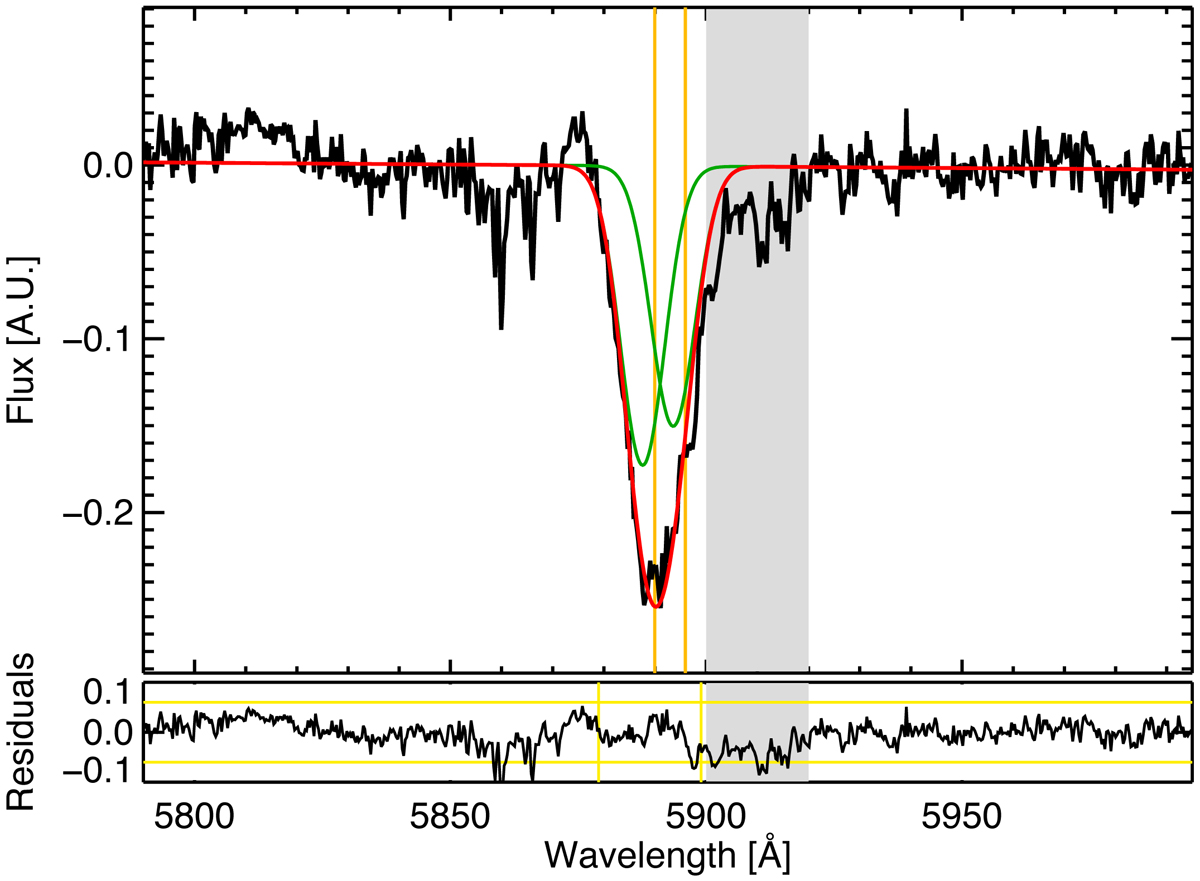
Example of absorption line spectra (black) after stellar subtraction (Sect. 3.2) and their modelling from the central region of MEGARA data (R = 1![]() 45, i.e. 160 pc). The grey band indicates the spectral band blocked during the fitting due to residuals from stellar subtraction (see Sect. 3.3.2). The orange vertical lines and the red and green curves, as well as both vertical and horizontal yellow lines, are as in Fig. 4.
45, i.e. 160 pc). The grey band indicates the spectral band blocked during the fitting due to residuals from stellar subtraction (see Sect. 3.3.2). The orange vertical lines and the red and green curves, as well as both vertical and horizontal yellow lines, are as in Fig. 4.
Current usage metrics show cumulative count of Article Views (full-text article views including HTML views, PDF and ePub downloads, according to the available data) and Abstracts Views on Vision4Press platform.
Data correspond to usage on the plateform after 2015. The current usage metrics is available 48-96 hours after online publication and is updated daily on week days.
Initial download of the metrics may take a while.