Fig. 6.
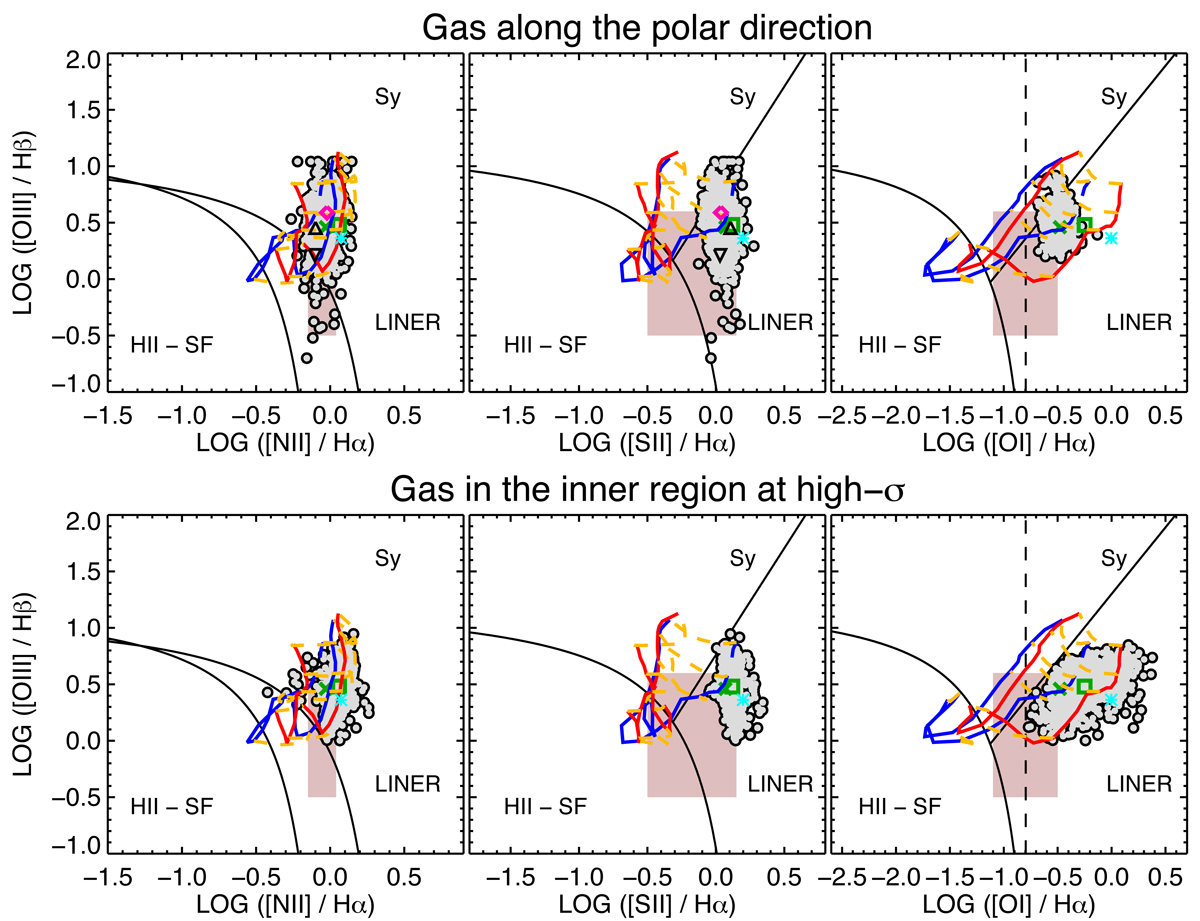
Download original image
Optical standard BPT diagrams for the primary component for the gas distributed in the polar direction and that in the central region at high-σ (top and bottom panels, respectively) obtained from MUSE data. The grey circles indicate the data points presented in this paper. The black lines in all diagrams represent the dividing curves between H II star-forming regions, Seyferts, and LINERs from Kewley et al. (2006) and Kauffmann et al. (2003). The pink boxes show the predictions of the photoionisation models by pAGB stars for Z = Z⊙, a burst age of 13 Gyr (Binette et al. 1994), and ionisation parameter values (log U) between −3 and −4. Log U is typically −3.5 in LINERs (Netzer 2015). The predictions of shock-ionisation models are overlaid in each diagram. Specifically, following Cazzoli et al. (2018), shock+precursor grids from Groves et al. (2004) are considered with Z = Z⊙ and for different ne. The blue and red curves correspond to models with ne = 1 cm−3 and ne = 100 cm−3, respectively (see also Sect. 4.2.1). The values plotted correspond to the minimum and maximum preshock magnetic field allowed in each model. In addition, only shock-velocities from 100 to 500 km s−1 (yellow dashed lines) are considered as larger σ are not observed for the primary component (Sect. 4.2.1). The dividing line between weak-[O I] and strong-[O I] LINERs (Filippenko & Terlevich 1992) is shown in black with a dashed line (right panels). In all diagrams, green symbols indicate the average values calculated in the polar (cross) and central (square) regions; as reference the cyan star is the typical value in the nucleus (average within the PSF region). In the top panels the pink diamond, black triangle, and black upside down triangle are the average BPT values for the faint features: the arm, the east, and south-east clumps, respectively (see Sect. 4.2.5). These features are not detected in [O I], hence no symbols are displayed in the corresponding diagnostic diagrams.
Current usage metrics show cumulative count of Article Views (full-text article views including HTML views, PDF and ePub downloads, according to the available data) and Abstracts Views on Vision4Press platform.
Data correspond to usage on the plateform after 2015. The current usage metrics is available 48-96 hours after online publication and is updated daily on week days.
Initial download of the metrics may take a while.