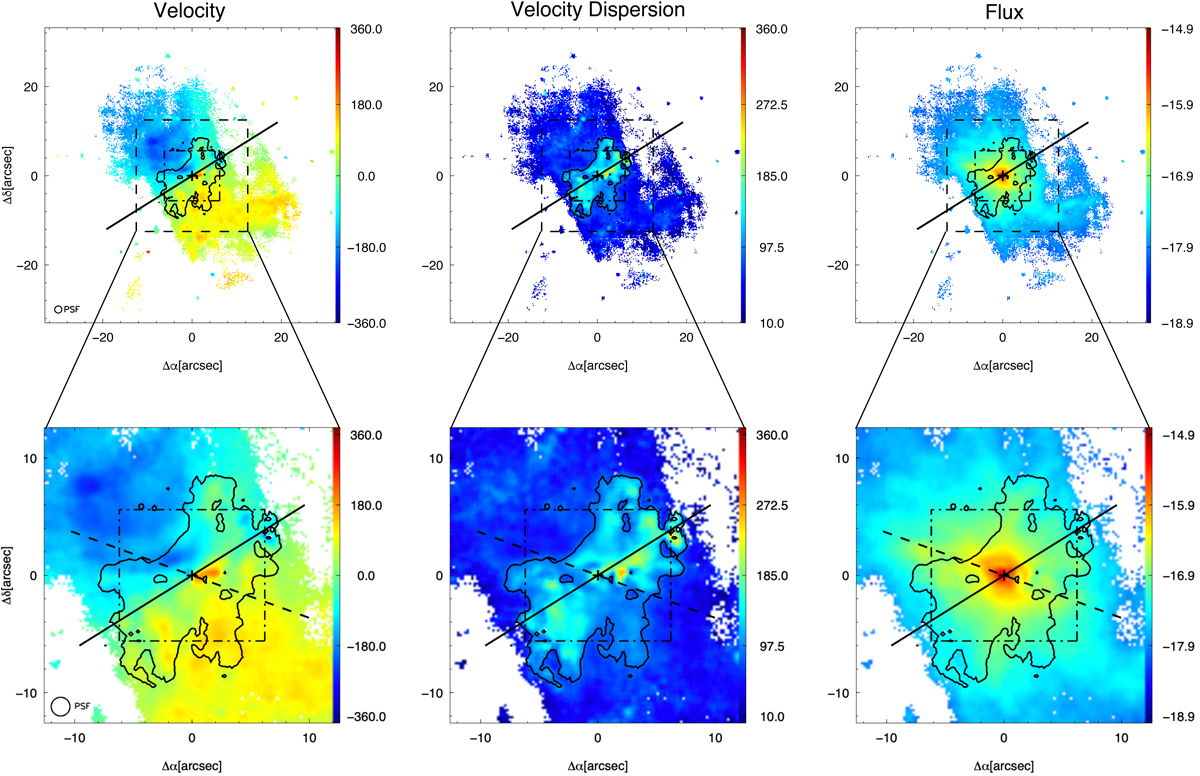
Fig. 5.
Download original image
Example of emission line maps produced from the fitting of the [O III]λ5007 line using the MUSE ISM cube (Sect. 3.3.1). Shown, from left to right, are the maps for the primary component: velocity field (km s−1), velocity dispersion (km s−1), and flux intensity (erg s−1 cm−1, log scale). The black solid line indicates the major axis of the stellar rotation (Table 4). The dot-dashed square indicates the MEGARA field of view. The contours indicate the central region at high velocity dispersion (see Sect. 4.2.3 for details). Top: maps covering a smaller field of view with respect to the original MUSE mosaic (80″ × 80″, Sect. 2.1) to highlight weak features. The dashed square indicates the selected zoomed-in view in the bottom panels of this figure and for Figs. B.1–B.13. Bottom: zoomed-in area. The dashed line indicates the orientation of the radio jet (Table 1).
Current usage metrics show cumulative count of Article Views (full-text article views including HTML views, PDF and ePub downloads, according to the available data) and Abstracts Views on Vision4Press platform.
Data correspond to usage on the plateform after 2015. The current usage metrics is available 48-96 hours after online publication and is updated daily on week days.
Initial download of the metrics may take a while.