Fig. 2.

Download original image
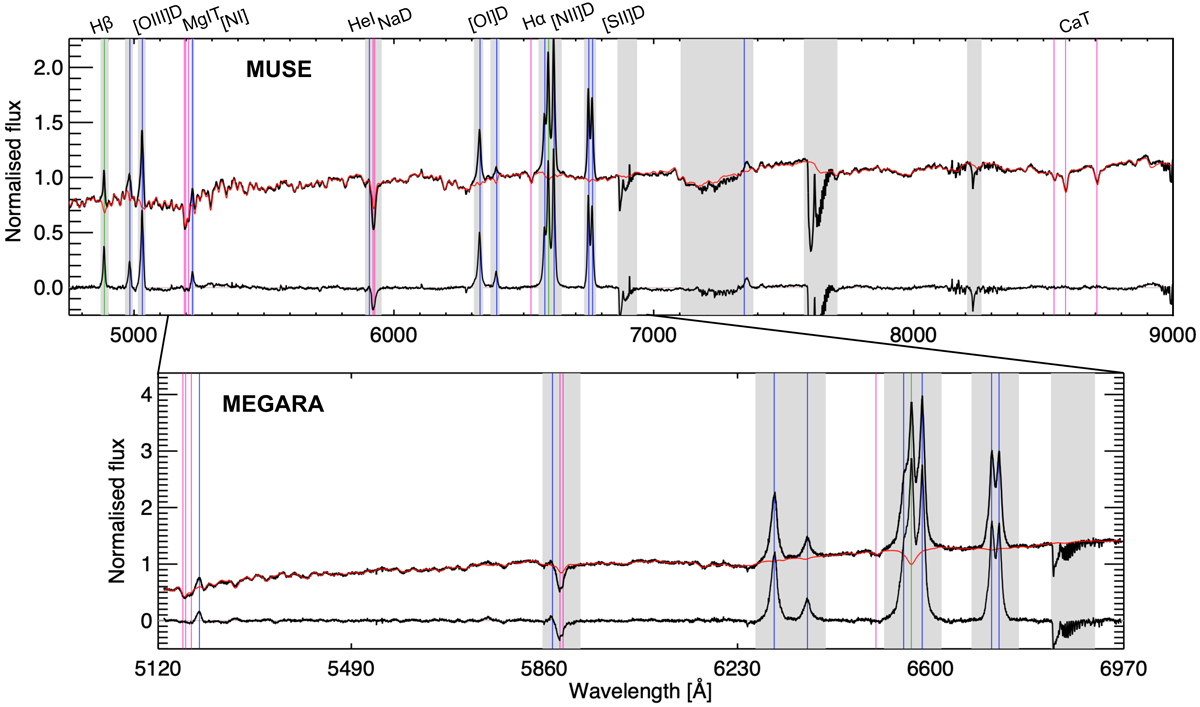
Example of stellar continuum modelling and its subtraction for high S/N nuclear spectra from MUSE (top panel) and MEGARA (bottom panel) data. The red line indicates the modelled stellar spectrum that matches the observed continuum, obtained applying the pPXF (Sect. 3.2). The wavelength regions blocked for the modelling are shown in grey. Spectral features are labelled at the top, and Balmer lines, forbidden lines, and absorption lines are shown in green, blue, and pink, respectively. In case of MEGARA we combined the cubes in LR-V and LR-R bands, which have a 70 Å overlap around 6130 Å (see Sect. 2.2).
Current usage metrics show cumulative count of Article Views (full-text article views including HTML views, PDF and ePub downloads, according to the available data) and Abstracts Views on Vision4Press platform.
Data correspond to usage on the plateform after 2015. The current usage metrics is available 48-96 hours after online publication and is updated daily on week days.
Initial download of the metrics may take a while.


