Fig. B.1.
Download original image
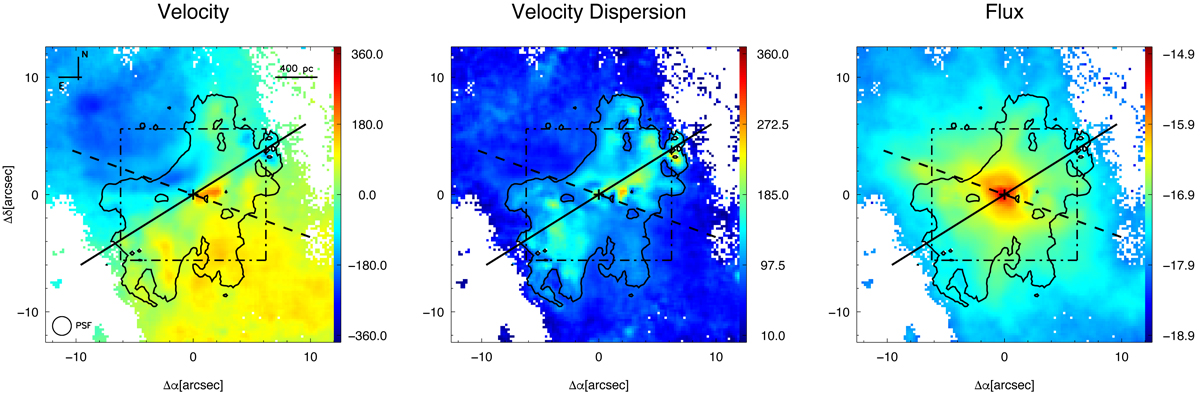
[O III]λ5007 velocity field (km s−1), velocity dispersion (km s−1), and flux intensity (erg s−1 cm−2) maps for the narrow component. The maps are as in the lower panel of Fig. 5, and are included here as reference. The black solid line indicates the major axis of the stellar rotation (Table 4). The dashed lines indicate the orientation of the radio jet (Table 1).
Current usage metrics show cumulative count of Article Views (full-text article views including HTML views, PDF and ePub downloads, according to the available data) and Abstracts Views on Vision4Press platform.
Data correspond to usage on the plateform after 2015. The current usage metrics is available 48-96 hours after online publication and is updated daily on week days.
Initial download of the metrics may take a while.