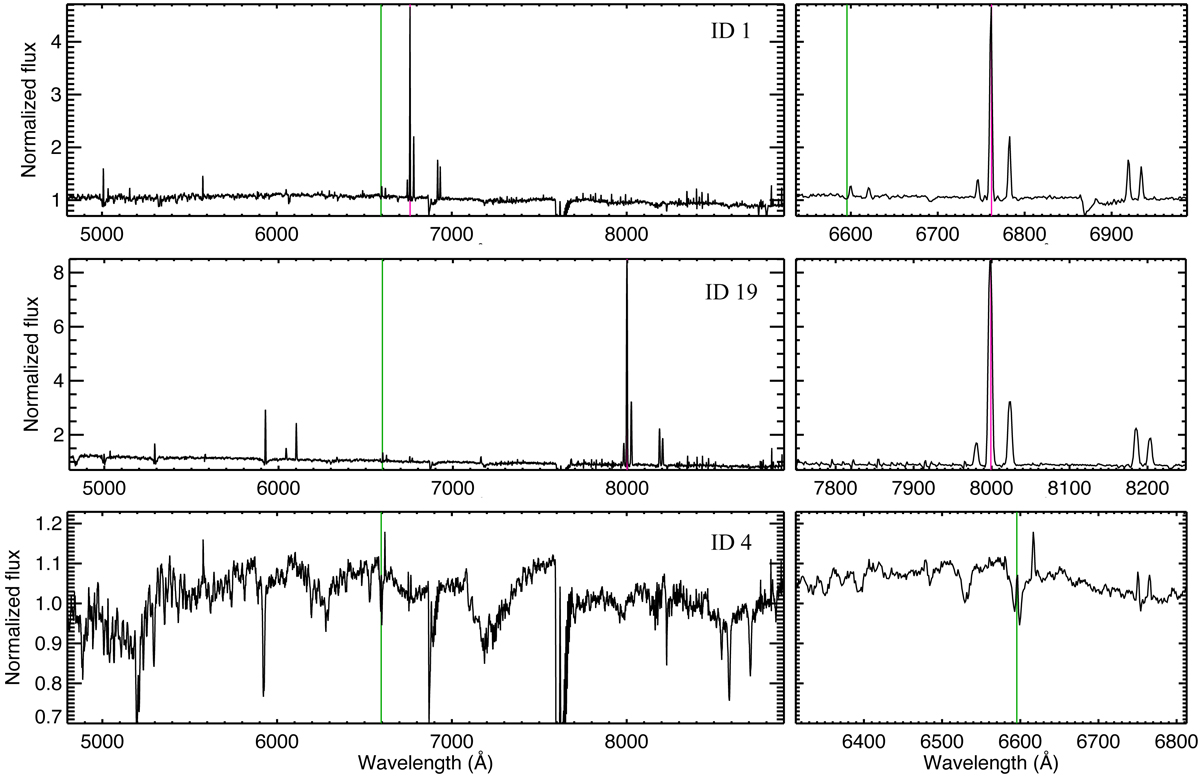
Fig. A.2.
Download original image
Spectra of the objects with ID numbers 1, 19, and 4 from Table A.1 (see also Fig. A.1). The right panel shows a zoomed-in view of the spectra region around Hα. The green lines indicate the wavelength of Hα at the redshift of NGC 1052 (z = 0.005, Table 1). The magenta lines in the first and second panels indicate the wavelength of Hα at the corresponding redshift (see text for details).
Current usage metrics show cumulative count of Article Views (full-text article views including HTML views, PDF and ePub downloads, according to the available data) and Abstracts Views on Vision4Press platform.
Data correspond to usage on the plateform after 2015. The current usage metrics is available 48-96 hours after online publication and is updated daily on week days.
Initial download of the metrics may take a while.