Fig. 11.
Download original image
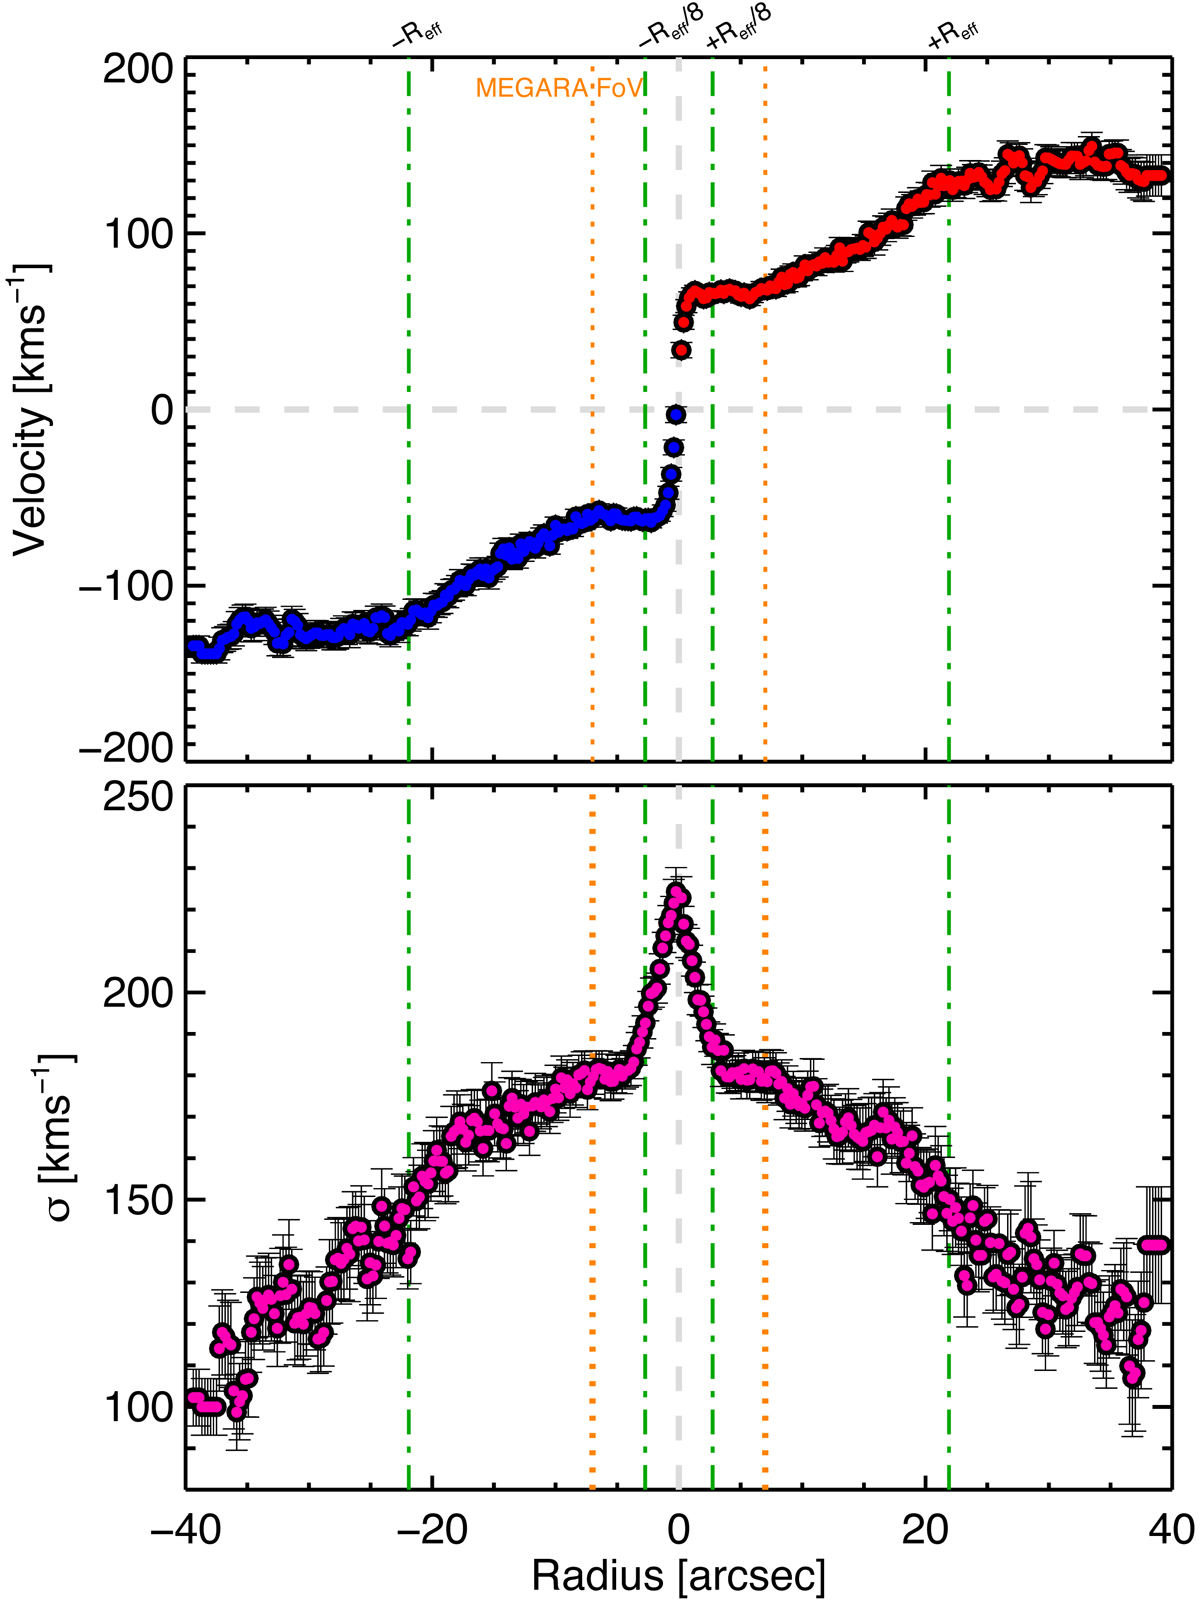
Position-velocity (P-V, top) and position-velocity dispersion (P-σ, bottom) curves of the stellar component of NGC 1052 from MUSE data (Sect. 4.1). Both curves were obtained considering a pseudo-slit of 1″ in width aligned according to the major axis of the rotation (i.e. 112°, Table 4). Velocities are centred to the kinematic centre, and the radius is calculated as the distance from the photometric centre. In the top panel the blue and red symbols indicate the approaching (negative velocities) and receding sides (positive velocities) of the rotation, respectively. The green lines give the Reff (21![]() 9, i.e. 2.4 kpc, Table 1) and Reff/8 (2
9, i.e. 2.4 kpc, Table 1) and Reff/8 (2![]() 75, i.e. 303 pc, Sect. 4.1), as labelled at the top. The grey dashed lines show the zero points for position and velocity, as reference. The field of view of the MEGARA observations is indicated with orange dotted lines. The typical uncertainty (extracted from the uncertainties estimated with pPXF) on the velocity and velocity dispersion measurements are generally ≤12 km s−1 and ≤14 km s−1, respectively.
75, i.e. 303 pc, Sect. 4.1), as labelled at the top. The grey dashed lines show the zero points for position and velocity, as reference. The field of view of the MEGARA observations is indicated with orange dotted lines. The typical uncertainty (extracted from the uncertainties estimated with pPXF) on the velocity and velocity dispersion measurements are generally ≤12 km s−1 and ≤14 km s−1, respectively.
Current usage metrics show cumulative count of Article Views (full-text article views including HTML views, PDF and ePub downloads, according to the available data) and Abstracts Views on Vision4Press platform.
Data correspond to usage on the plateform after 2015. The current usage metrics is available 48-96 hours after online publication and is updated daily on week days.
Initial download of the metrics may take a while.