Fig. 10.
Download original image
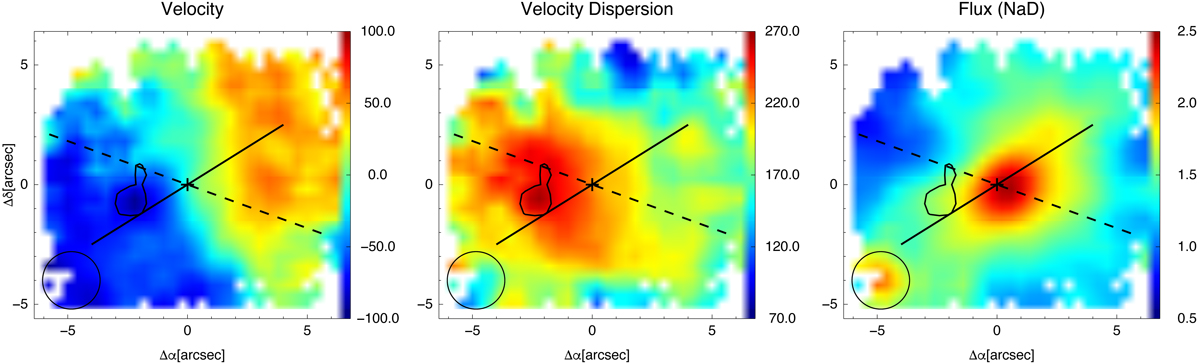
Neutral gas velocity field (km s−1), velocity dispersion (km s−1), and flux intensity (mJy) maps for the single kinematic component used to model NaD. The black lines are as in Fig. B.11. Specifically, the black solid line indicates the major axis of the stellar rotation (Table 4). The dashed lines indicate the orientation of the radio jet (Table 1). The contours indicate the region at high velocity dispersion (Sect. 5.4 for details).
Current usage metrics show cumulative count of Article Views (full-text article views including HTML views, PDF and ePub downloads, according to the available data) and Abstracts Views on Vision4Press platform.
Data correspond to usage on the plateform after 2015. The current usage metrics is available 48-96 hours after online publication and is updated daily on week days.
Initial download of the metrics may take a while.