Fig. 1.
Download original image
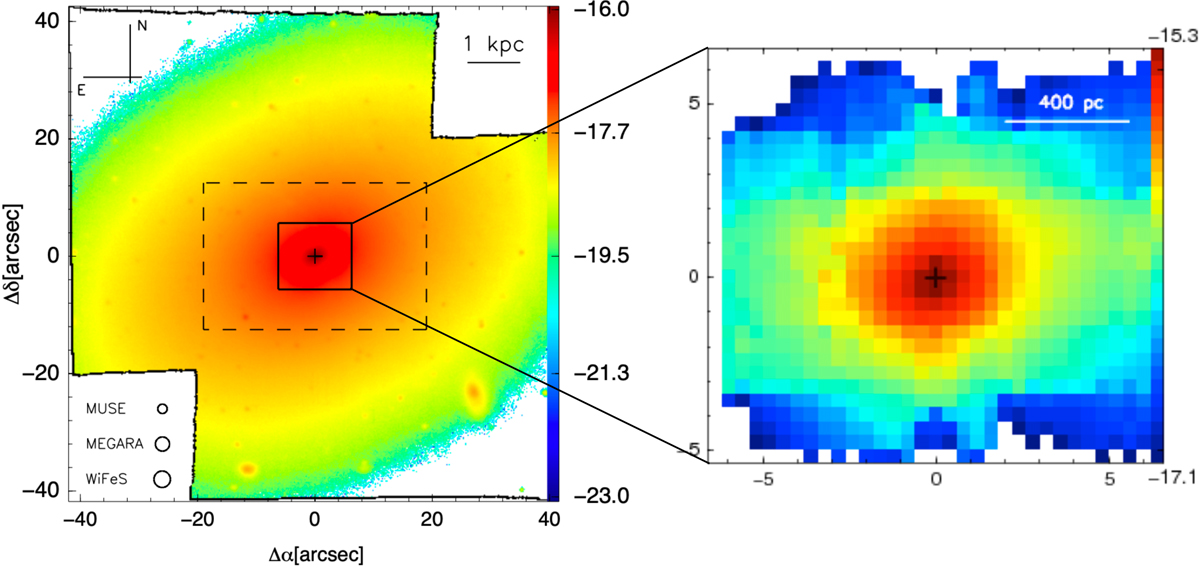
Optical continuum images computed from MUSE (left) and MEGARA (right) in units of erg s−1 cm−2 (logarithmic scale). To obtain these images we considered a 60 Å wide continuum band (6105 − 6165 Å). The cross is the photometric centre, and the sizes of the different PSFs for MEGARA and MUSE data are indicated in the bottom left part of the figure (see also Sect. 2). As reference we show the field of view (dashed rectangle) and average seeing (1![]() 4, bottom circle) for the WiFeS datacube analysed in D15. The black bar at the upper right represents 1 kpc (∼9″) at the redshift of NGC 1052 (see Table 1). Similarly, the white bar at the upper right, right panel, represents 400 pc (∼3
4, bottom circle) for the WiFeS datacube analysed in D15. The black bar at the upper right represents 1 kpc (∼9″) at the redshift of NGC 1052 (see Table 1). Similarly, the white bar at the upper right, right panel, represents 400 pc (∼3![]() 6).
6).
Current usage metrics show cumulative count of Article Views (full-text article views including HTML views, PDF and ePub downloads, according to the available data) and Abstracts Views on Vision4Press platform.
Data correspond to usage on the plateform after 2015. The current usage metrics is available 48-96 hours after online publication and is updated daily on week days.
Initial download of the metrics may take a while.