Fig. 7
Download original image
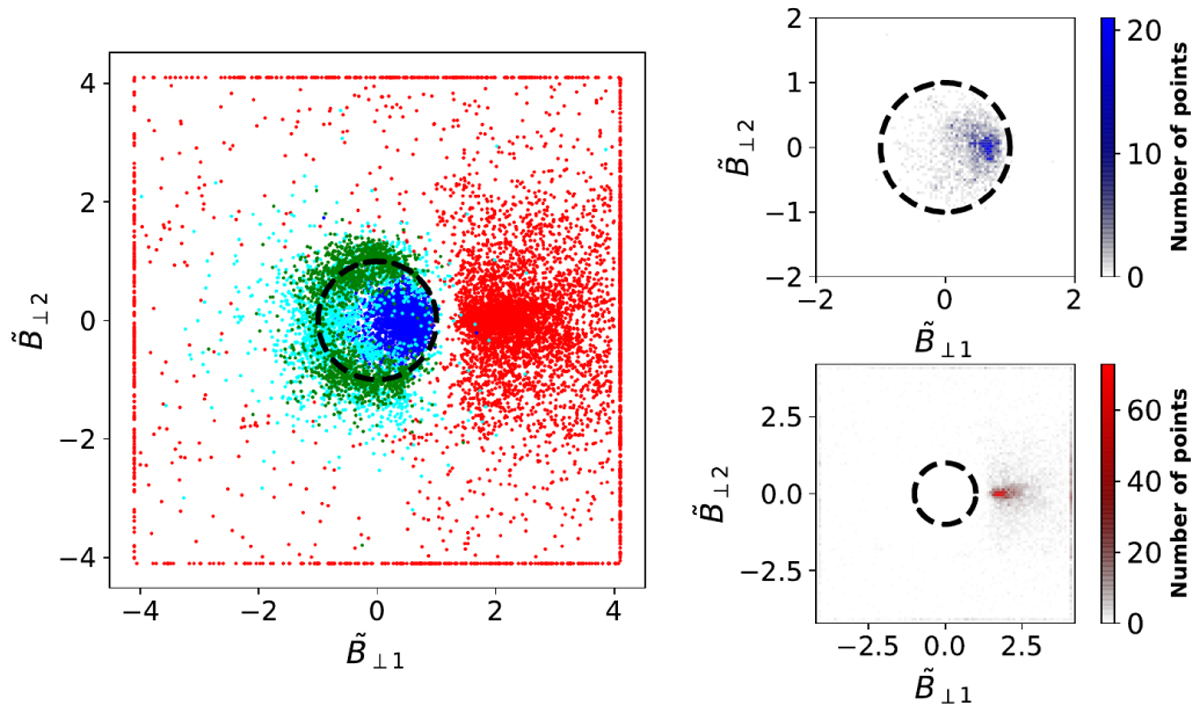
OT Pm = 1 run near dissipation peak (at time t = 1/3tturnover). Hodogram in which the pre-shock magnetic field is normalised and rotated such that ![]() . The post-shock magnetic field is plotted according to this rotation and normalisation. Red dots denote fast shocks, blue ones slow shocks, green is for rotational discontinuities, and cyan is for Parker sheets. On the right, the top plot is the probability density function of the number of blue dots from the left plot. The bottom right one is for red dots. The dashed line is the unity radius circle that separates discontinuities where the transverse magnetic field increases (outside the circle) decreases (inside the circle).
. The post-shock magnetic field is plotted according to this rotation and normalisation. Red dots denote fast shocks, blue ones slow shocks, green is for rotational discontinuities, and cyan is for Parker sheets. On the right, the top plot is the probability density function of the number of blue dots from the left plot. The bottom right one is for red dots. The dashed line is the unity radius circle that separates discontinuities where the transverse magnetic field increases (outside the circle) decreases (inside the circle).
Current usage metrics show cumulative count of Article Views (full-text article views including HTML views, PDF and ePub downloads, according to the available data) and Abstracts Views on Vision4Press platform.
Data correspond to usage on the plateform after 2015. The current usage metrics is available 48-96 hours after online publication and is updated daily on week days.
Initial download of the metrics may take a while.