Fig. 6
Download original image
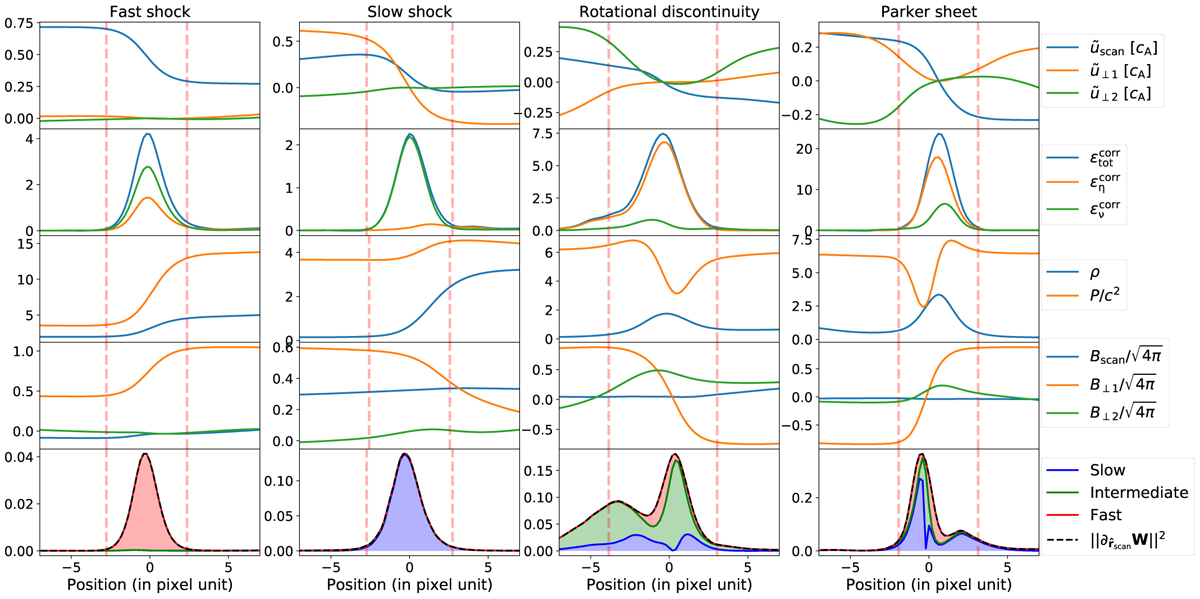
Representative scan profiles used to identify the different kinds of dissipation structures in our simulations (here, for the ABC simulation at Pm = 1 at time t = tturnover/3). The first four rows of plots show, respectively, velocities (in the local velocity frame of the scan, and normalised by the initial r.m.s Alfvén speed), dissipation rates, density and total pressure, and magnetic field components’ profiles. The last row shows gradient decomposition into ideal waves. The coloured surfaces in between the curves is proportional to the weight of each corresponding ideal wave (in the decomposition presented in Sect. 2.4). Vertical dashed lines on each plot mark the positions of pre- and post-discontinuity that we define in Sect. 3.2.2.
Current usage metrics show cumulative count of Article Views (full-text article views including HTML views, PDF and ePub downloads, according to the available data) and Abstracts Views on Vision4Press platform.
Data correspond to usage on the plateform after 2015. The current usage metrics is available 48-96 hours after online publication and is updated daily on week days.
Initial download of the metrics may take a while.