Fig. 5
Download original image
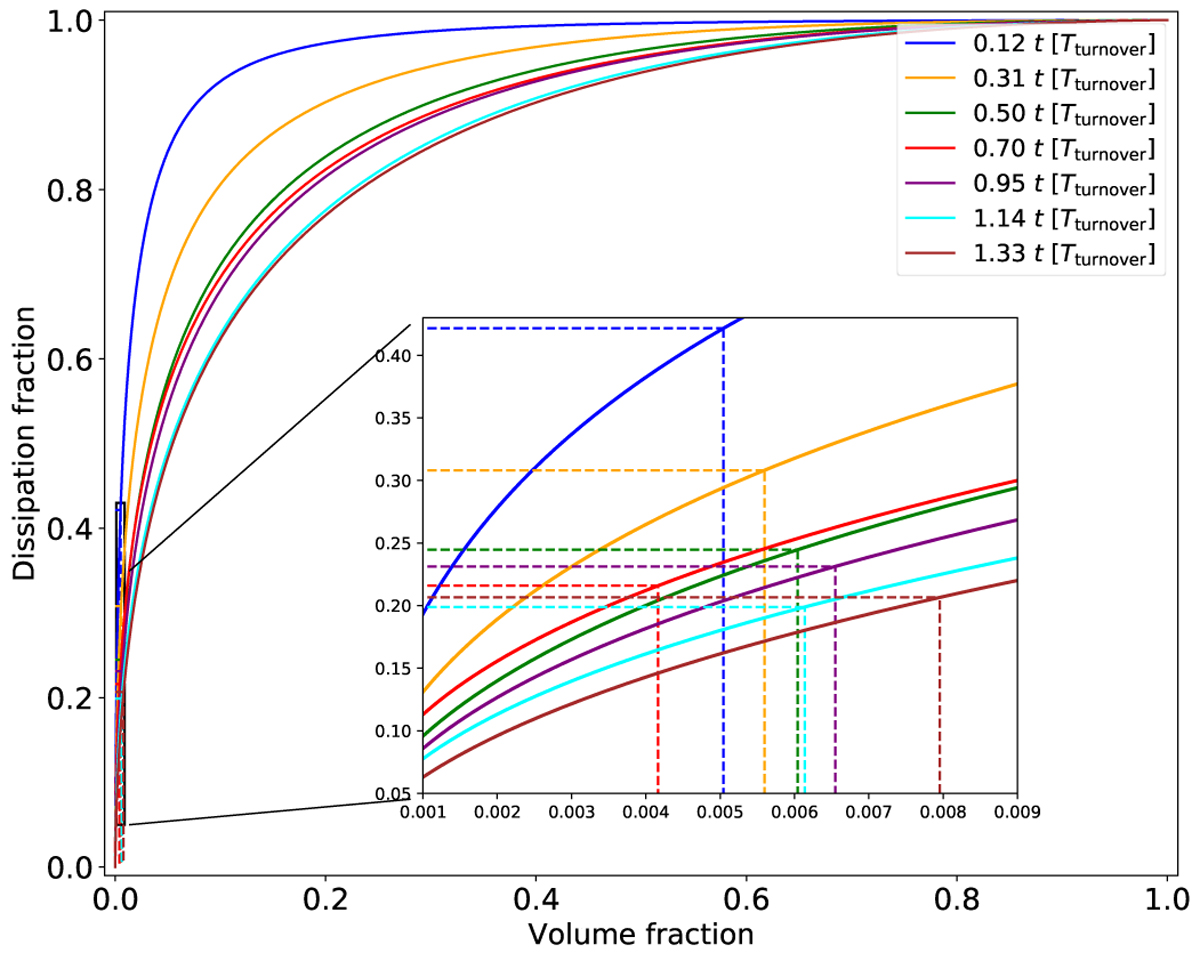
Dissipation filling factor for a simulation with OT initial conditions that started at ℳs = 4. Each solid-coloured curve gives the total dissipation corresponding to the fraction of the volume occupied by the most dissipative regions for different time steps. Vertical dashed lines mark the volume occupied by the selected threshold for the structure detection (![]() ), and the horizontal ones mark the global dissipation fraction that it represents at each time step.
), and the horizontal ones mark the global dissipation fraction that it represents at each time step.
Current usage metrics show cumulative count of Article Views (full-text article views including HTML views, PDF and ePub downloads, according to the available data) and Abstracts Views on Vision4Press platform.
Data correspond to usage on the plateform after 2015. The current usage metrics is available 48-96 hours after online publication and is updated daily on week days.
Initial download of the metrics may take a while.