Fig. 3
Download original image
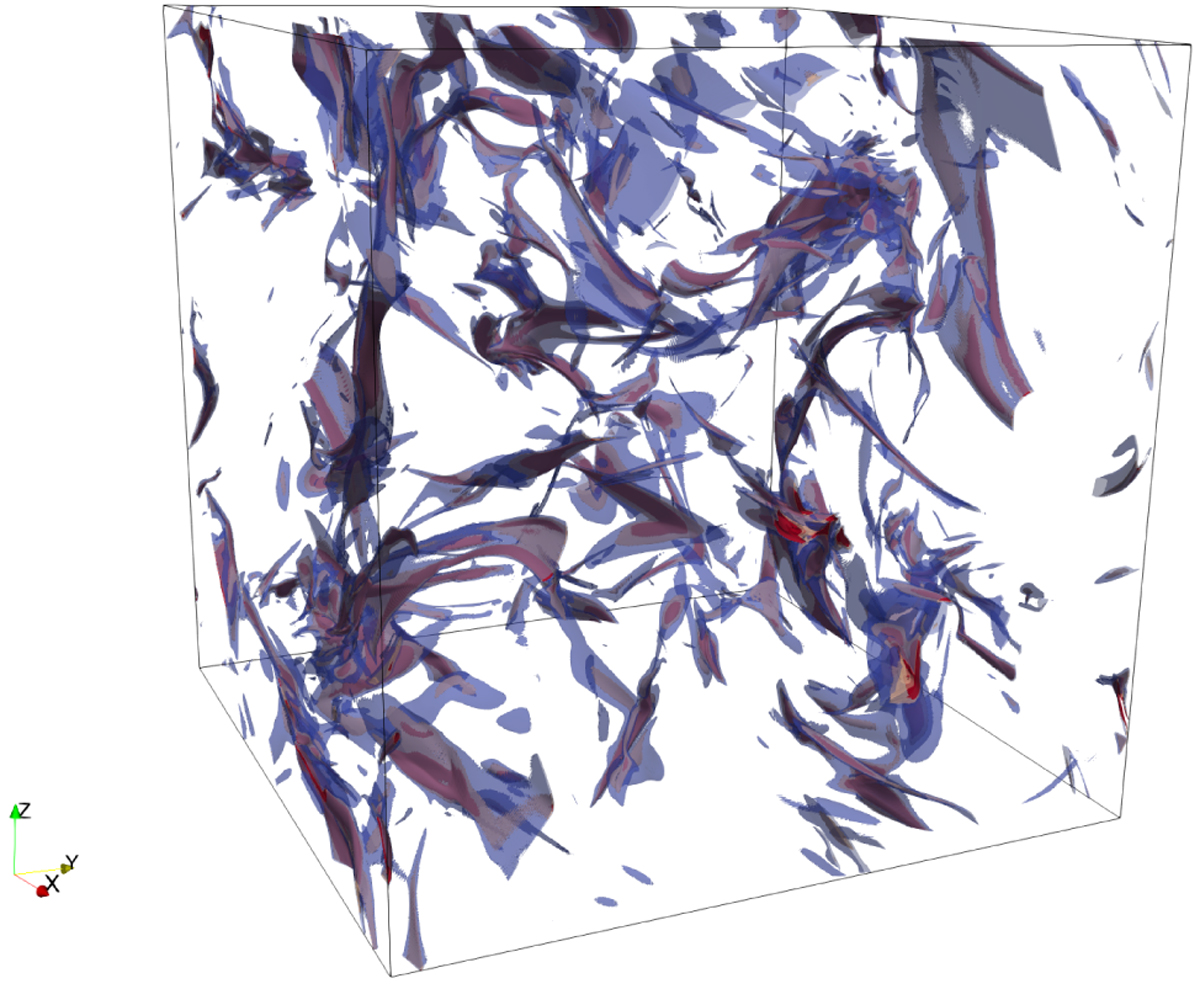
Intense dissipation structures extracted from an OT initial conditions simulation with Pm = 1. The time step of this output is t ≃ 1/3tturnover. Structures are shown through dissipation isocontours. The first one, in blue, is set at ![]() . The second, in beige, is at 8 times the standard deviation above the mean value, and the last one, in red, is at 13.5 times the standard deviation above the mean value.
. The second, in beige, is at 8 times the standard deviation above the mean value, and the last one, in red, is at 13.5 times the standard deviation above the mean value.
Current usage metrics show cumulative count of Article Views (full-text article views including HTML views, PDF and ePub downloads, according to the available data) and Abstracts Views on Vision4Press platform.
Data correspond to usage on the plateform after 2015. The current usage metrics is available 48-96 hours after online publication and is updated daily on week days.
Initial download of the metrics may take a while.