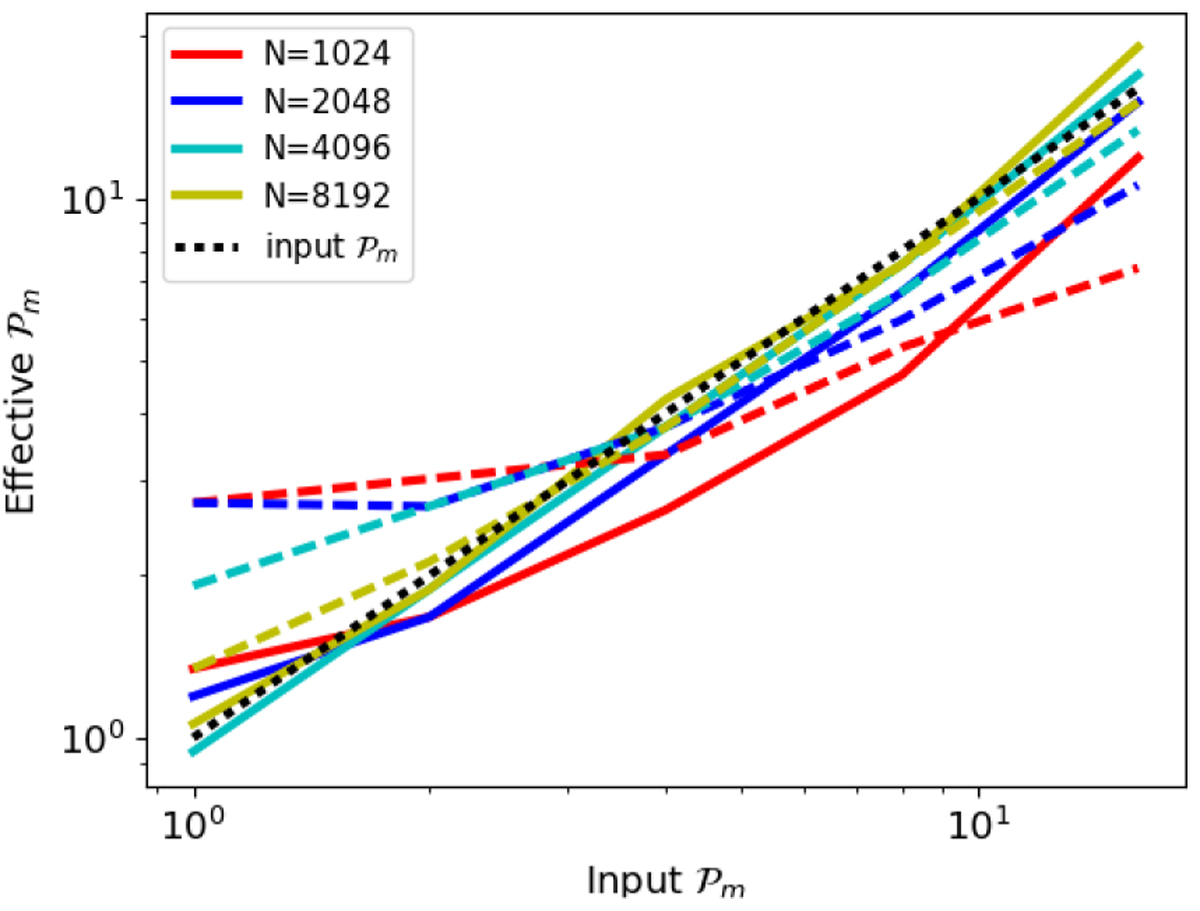
Fig. B.4
Download original image
Comparison between effective Ƥm and input Ƥm (dotted black line) for various resolutions and the two fast shocks of Figure B.3 (solid lines for u0 = 1 and dashed lines for u0 = 4). Ƥm was varied by keeping the value of the resistive coefficient η = 0.7 × 10⁻³ fixed while varying the value of the viscous coefficient accordingly v = ηƤm.
Current usage metrics show cumulative count of Article Views (full-text article views including HTML views, PDF and ePub downloads, according to the available data) and Abstracts Views on Vision4Press platform.
Data correspond to usage on the plateform after 2015. The current usage metrics is available 48-96 hours after online publication and is updated daily on week days.
Initial download of the metrics may take a while.