Open Access
Fig. B.2
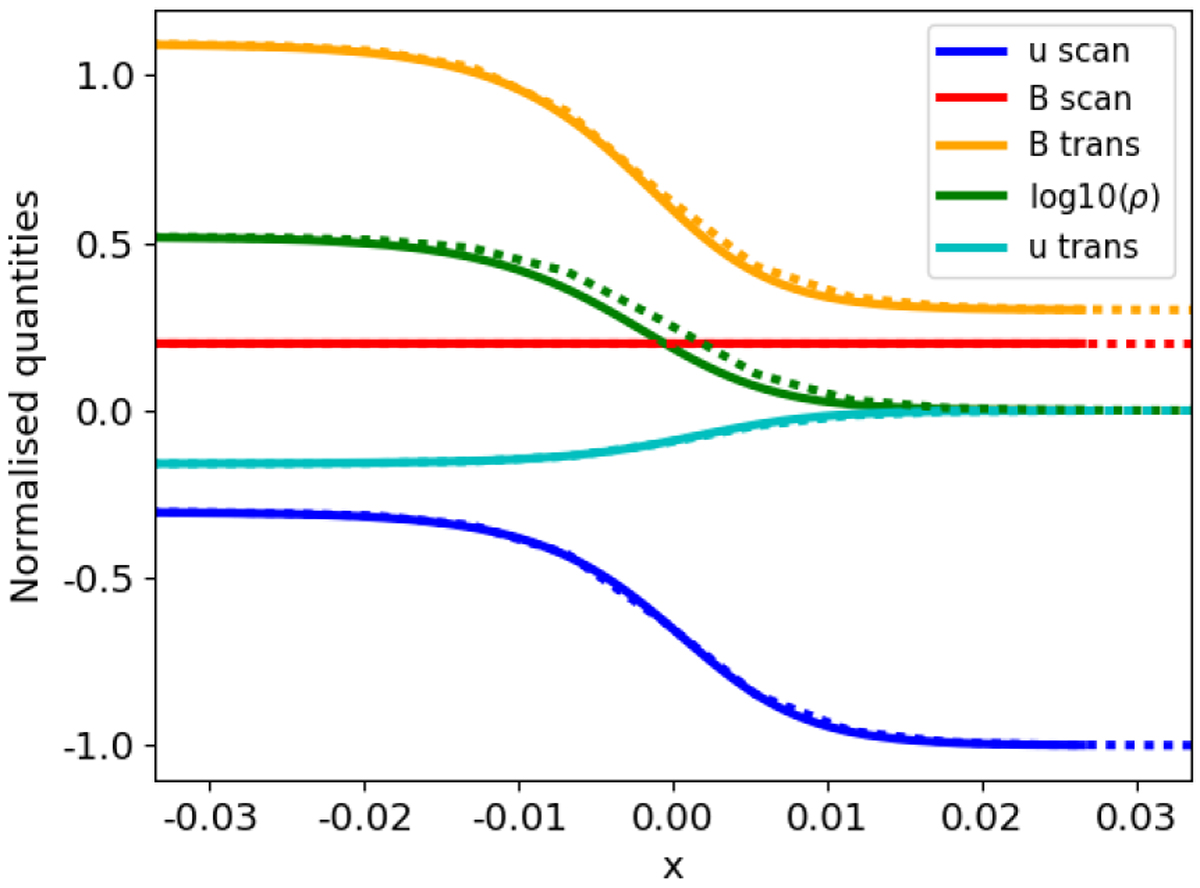
Download original image
Comparison of profiles of various state variables of the gas for the same fast shock as Fig. B.1 between the results of our simulation at N = 1024 (dotted lines) and the best-fit model (solid line). Best fit coefficients are v = 2.2 × 10⁻³ and η = 1.7 × 10⁻³ (input coefficients are η = v = 0.7 × 10⁻³).
Current usage metrics show cumulative count of Article Views (full-text article views including HTML views, PDF and ePub downloads, according to the available data) and Abstracts Views on Vision4Press platform.
Data correspond to usage on the plateform after 2015. The current usage metrics is available 48-96 hours after online publication and is updated daily on week days.
Initial download of the metrics may take a while.