Open Access
Fig. 2
Download original image
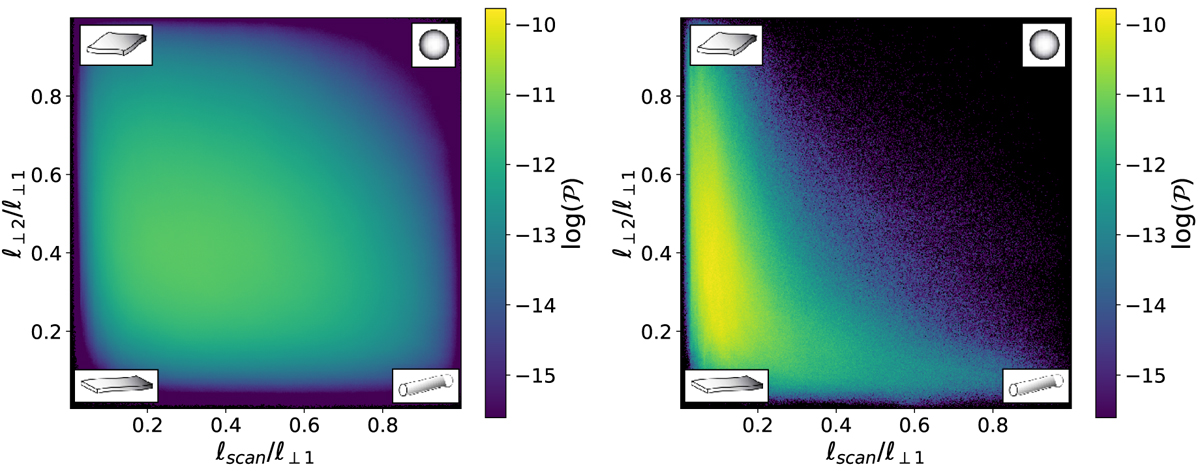
2D joint probability density function of gradients’ aspect ratios (for the OT simulation at Pm = 1 at time t = tturnover/3). On the left, characteristic lengths are calculated for all the simulation cells. While on the right, the domain is restricted to cells where ![]() . The colour scale is logarithmic.
. The colour scale is logarithmic.
Current usage metrics show cumulative count of Article Views (full-text article views including HTML views, PDF and ePub downloads, according to the available data) and Abstracts Views on Vision4Press platform.
Data correspond to usage on the plateform after 2015. The current usage metrics is available 48-96 hours after online publication and is updated daily on week days.
Initial download of the metrics may take a while.