Fig. 19
Download original image
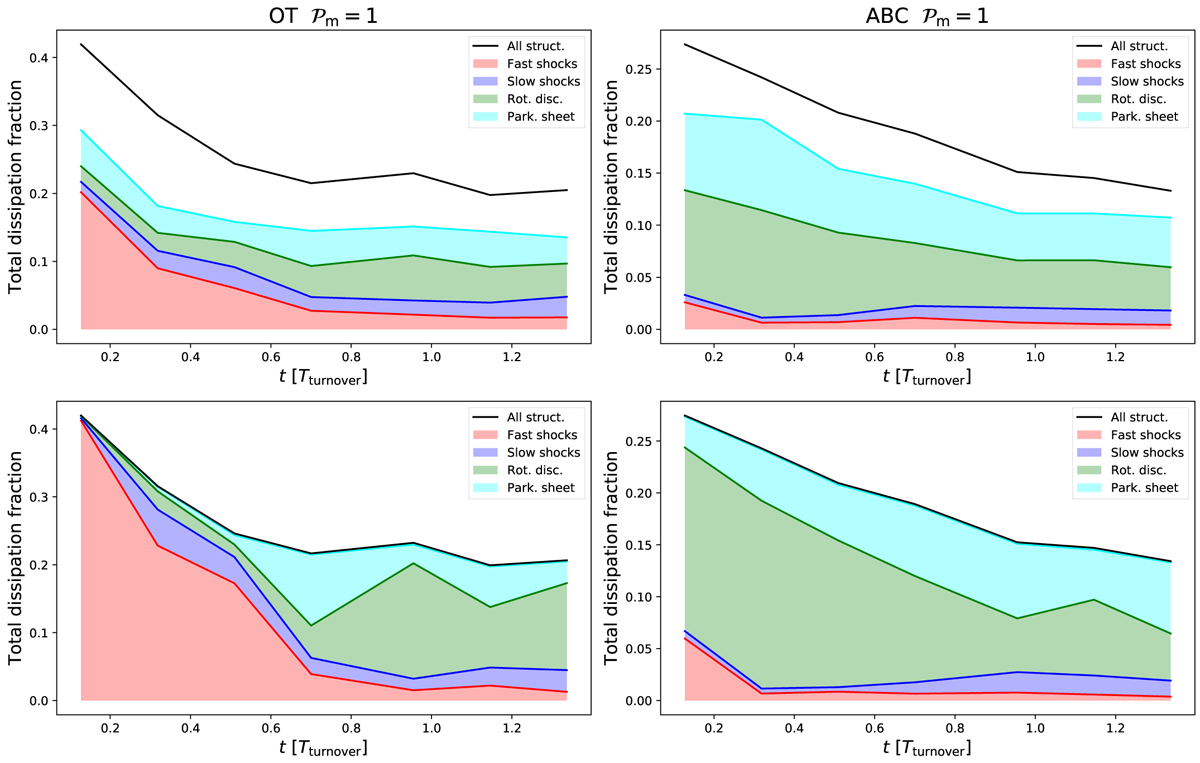
Contribution of dissipative structures and their different natures to global dissipation. Top plots: fraction of the total dissipation high dissipation structure contribute to (black line) and the contribution of cells that belong to a scan that is identified (coloured areas) for OT and ABC initial conditions simulations. Bottom plots: we use the most represented identification in each structure and attribute the total dissipation rate of the structure to this kind. This method is supported by the fact that we find connected structures to be mainly made of one kind of discontinuity.
Current usage metrics show cumulative count of Article Views (full-text article views including HTML views, PDF and ePub downloads, according to the available data) and Abstracts Views on Vision4Press platform.
Data correspond to usage on the plateform after 2015. The current usage metrics is available 48-96 hours after online publication and is updated daily on week days.
Initial download of the metrics may take a while.