Fig. 16
Download original image
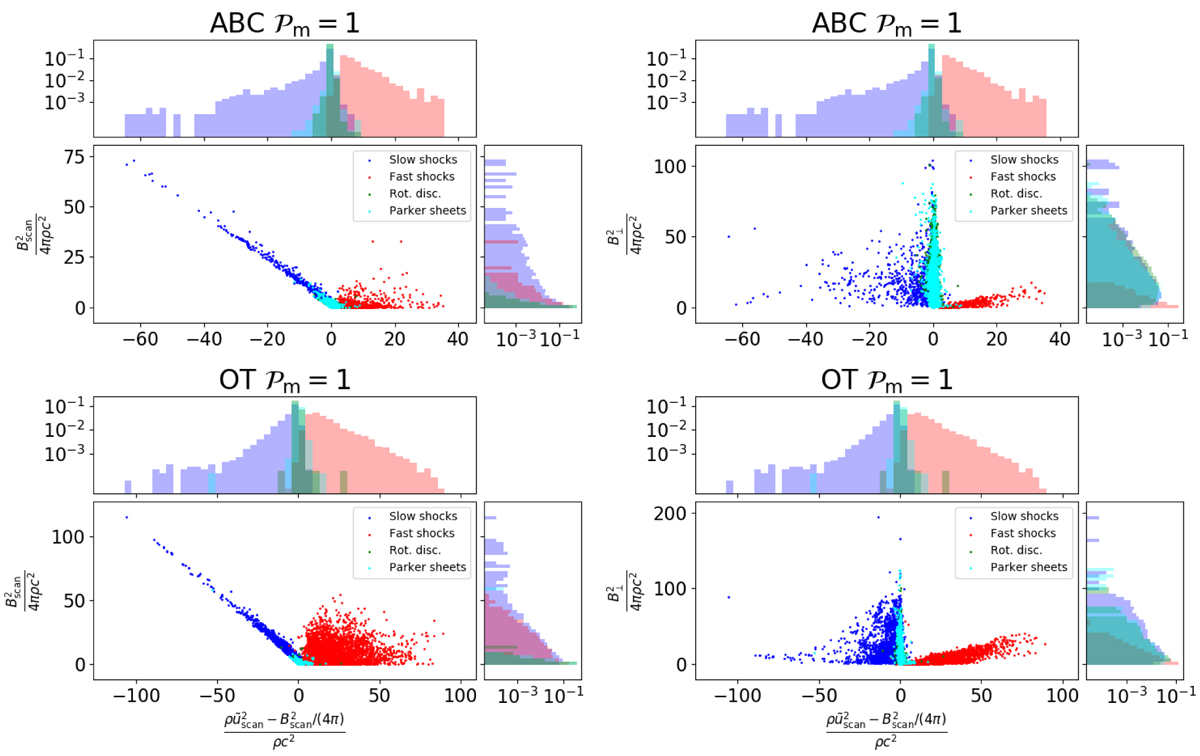
Entrance (pre-discontinuity) parameters for each scan we identify at time t = tturnover/3. The position of the pre-discontinuity is defined in Sect. 3.3 (as three times the dissipation length ℓɛ before the dissipation peak). Top plots are for ABC initial conditions and bottom plots are for OT ones. The x-axis is the difference between ram and magnetic normal pressures. In left plots, the y-axis represents the magnetic pressure in the scan direction, and in the right ones it represents the transverse magnetic pressure. All quantities are normalised by the thermal pressure (p = pc2). Integrated PDFs are given on each side of the panels.
Current usage metrics show cumulative count of Article Views (full-text article views including HTML views, PDF and ePub downloads, according to the available data) and Abstracts Views on Vision4Press platform.
Data correspond to usage on the plateform after 2015. The current usage metrics is available 48-96 hours after online publication and is updated daily on week days.
Initial download of the metrics may take a while.