Fig. 12
Download original image
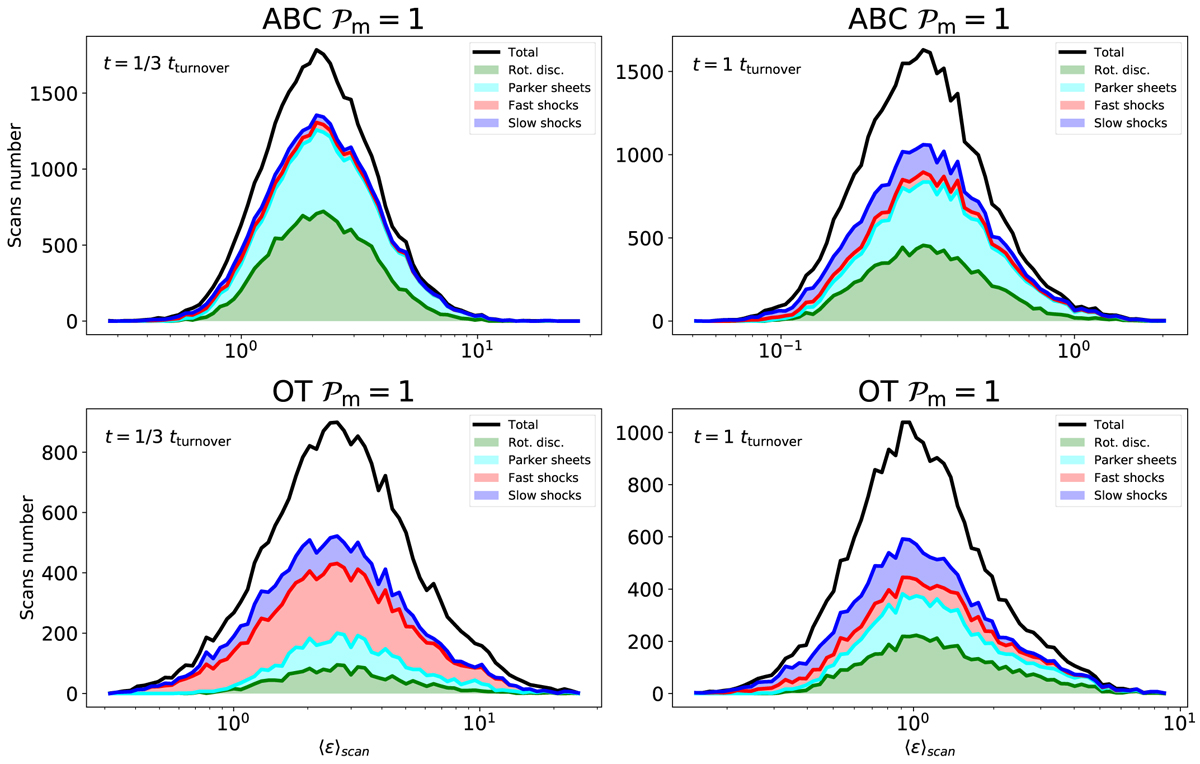
Distribution of different types of structure in terms of the mean scanned dissipation across the discontinuity. The black curve is the total distribution of scans, whereas coloured curves are identified structures’ contributions. The white area corresponds to unknown dissipation scans. Top plots are for ABC initial conditions, while bottom ones are for the OT flow. Distributions on the left are at an early time (≃1/3ttumover). The right panel shows the same distribution at t = ttmmover.
Current usage metrics show cumulative count of Article Views (full-text article views including HTML views, PDF and ePub downloads, according to the available data) and Abstracts Views on Vision4Press platform.
Data correspond to usage on the plateform after 2015. The current usage metrics is available 48-96 hours after online publication and is updated daily on week days.
Initial download of the metrics may take a while.