Fig. 11
Download original image
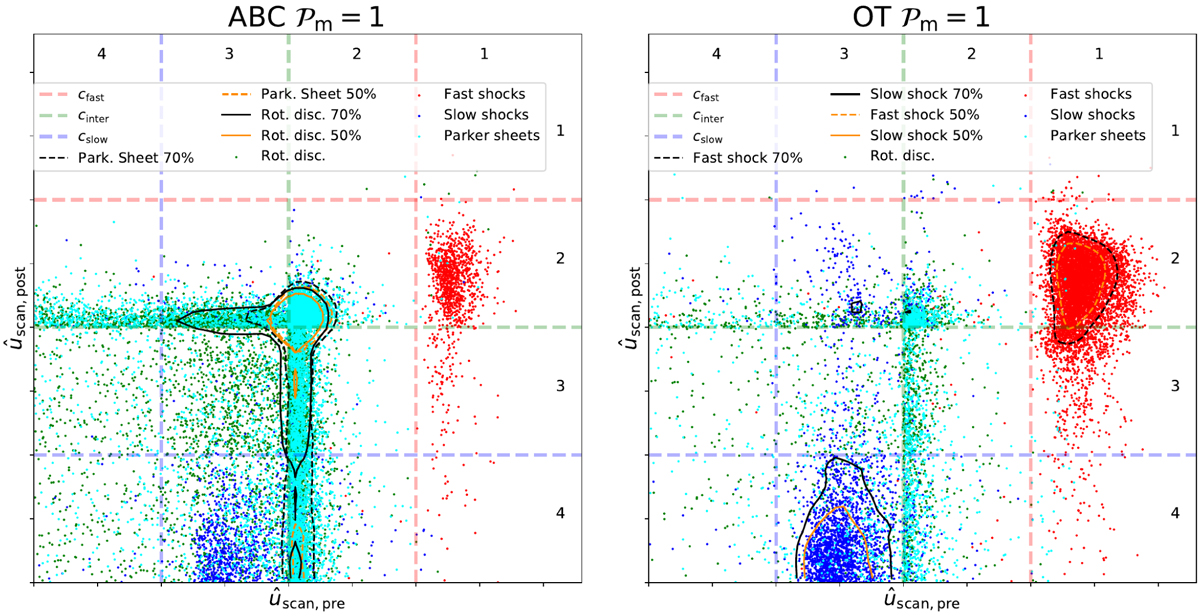
The scatter plot on the left is for ABC, and the one on the right is for OT (Pm =1), both near the dissipation peak. For each scan, we computed pre- and post-shock slow, intermediate, and fast velocities. We compared fluid velocities to these characteristic speeds in the stationary wave frame. We normalised velocities according to the pre- and post-regime following Eqs. (34) to (37). X-axis is the pre-shock regime and Y-axis the post-shock regime. Thus, each kind of discontinuity, in the classical MHD discontinuity classification, belongs to one box. Isocontours in solid and dashed lines were computed for the two most represented kinds of profile. The zones inside the contours delineate the densest area comprising, respectively, 70% (black) and 50% (orange) of the dots.
Current usage metrics show cumulative count of Article Views (full-text article views including HTML views, PDF and ePub downloads, according to the available data) and Abstracts Views on Vision4Press platform.
Data correspond to usage on the plateform after 2015. The current usage metrics is available 48-96 hours after online publication and is updated daily on week days.
Initial download of the metrics may take a while.