Fig. 1
Download original image
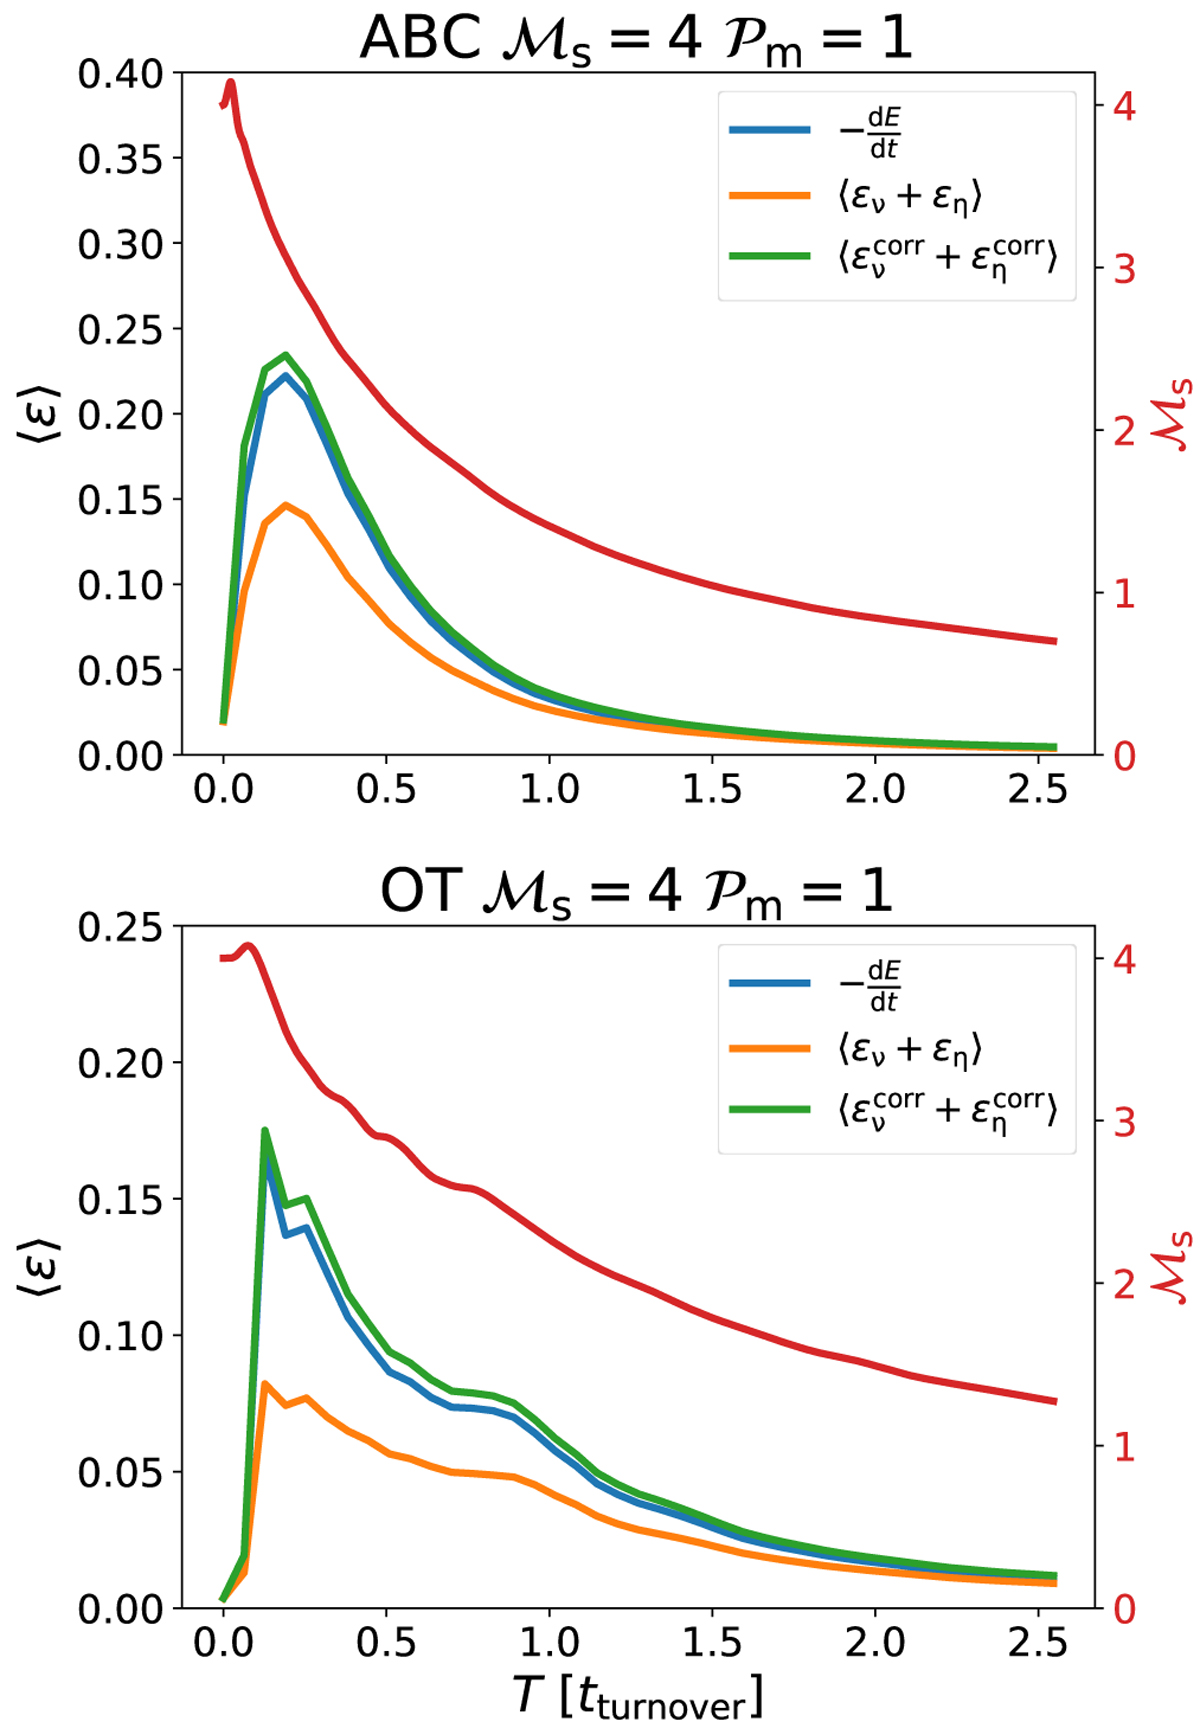
Time evolution of volume-integrated dissipation rates for the ABC and OT, Pm = 1 runs. The blue line is the time derivative of the integrated isothermal generalised mechanical energy ![]() . The orange curve is the sum of the physical viscous and ohmic dissipations computed from the velocity and magnetic fields (Eqs. (11) and (12), respectively). The green line is the volume-integrated corrected dissipation field
. The orange curve is the sum of the physical viscous and ohmic dissipations computed from the velocity and magnetic fields (Eqs. (11) and (12), respectively). The green line is the volume-integrated corrected dissipation field ![]() determined by our recovery method (see text and Appendix B). We note that the timescale is in units of initial turnover timescale; we display t/tturnover where
determined by our recovery method (see text and Appendix B). We note that the timescale is in units of initial turnover timescale; we display t/tturnover where ![]() . We also show the evolution of the r.m.s. sonic Mach number ℳs (red curve); its scale corresponds to the right axis.
. We also show the evolution of the r.m.s. sonic Mach number ℳs (red curve); its scale corresponds to the right axis.
Current usage metrics show cumulative count of Article Views (full-text article views including HTML views, PDF and ePub downloads, according to the available data) and Abstracts Views on Vision4Press platform.
Data correspond to usage on the plateform after 2015. The current usage metrics is available 48-96 hours after online publication and is updated daily on week days.
Initial download of the metrics may take a while.