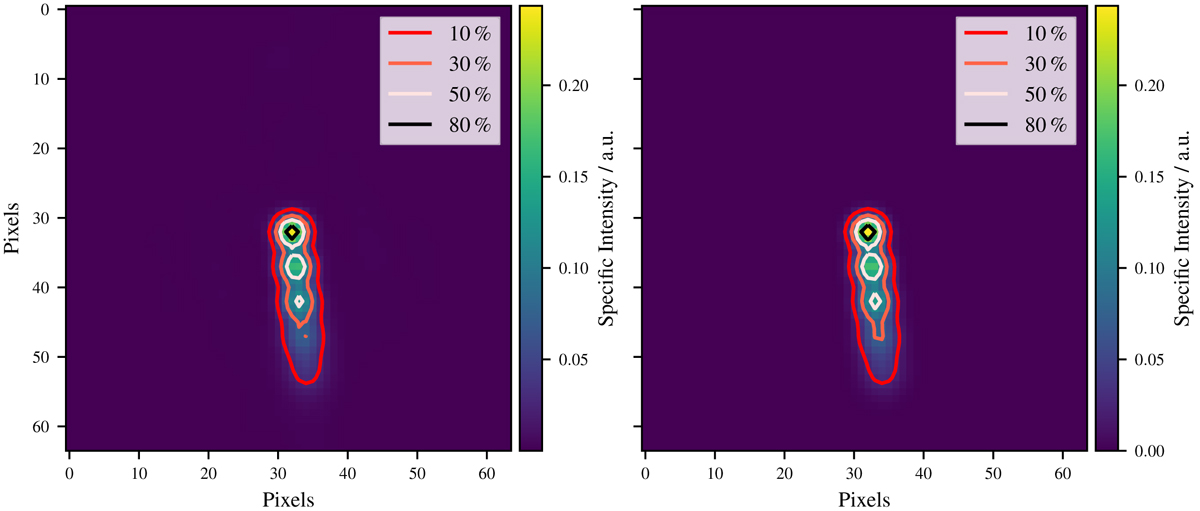
Fig. B.1
Download original image
Exemplary contour plot for a training session with clean input images. Resulting clean image (left) and simulated brightness distribution (right) are shown. For both images, the contour levels are based on the peak flux density of the simulated brightness distribution. The ratio of 0.98 is calculated between the 10% boundary of the prediction and the truth.
Current usage metrics show cumulative count of Article Views (full-text article views including HTML views, PDF and ePub downloads, according to the available data) and Abstracts Views on Vision4Press platform.
Data correspond to usage on the plateform after 2015. The current usage metrics is available 48-96 hours after online publication and is updated daily on week days.
Initial download of the metrics may take a while.