Fig. 7
Download original image
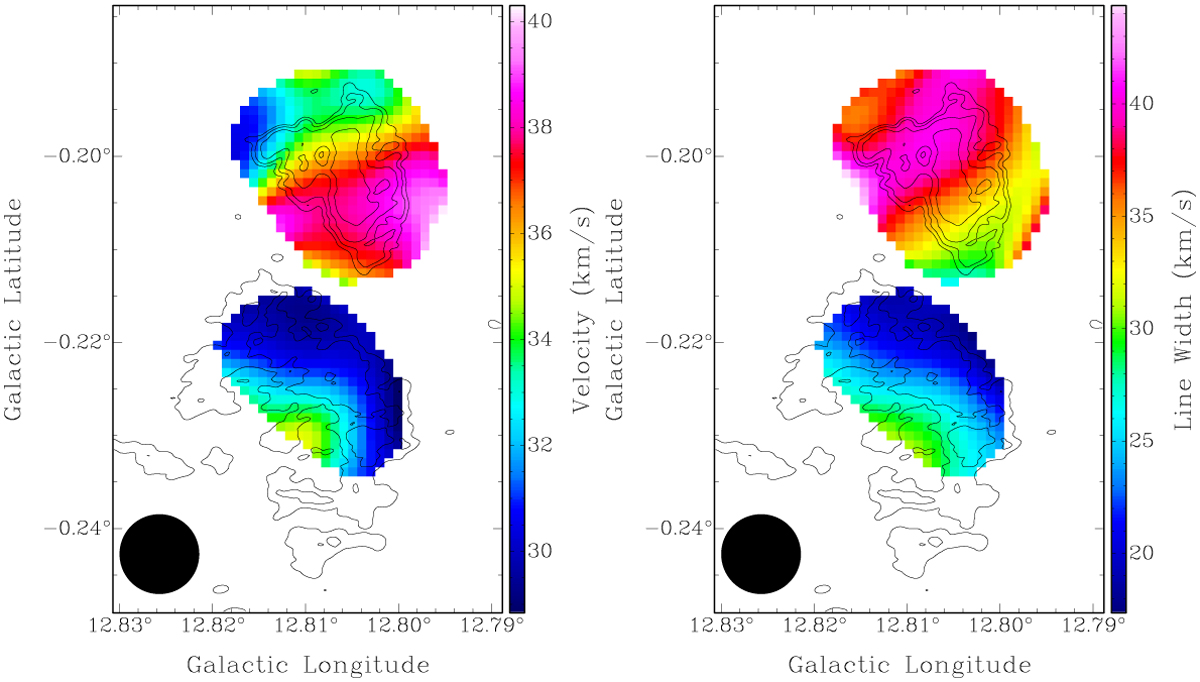
Velocity field and a map of the line width obtained from the Gaussian fitting of GLOSTAR stacked recombination line data is shown in the left and right panels respectively. The maps are overlaid with contours of the radio emission at 1400 MHz at full resolution. The contour levels are as described in Fig. 1 (left panel). The black-filled circle represents the GLOSTAR beam size.
Current usage metrics show cumulative count of Article Views (full-text article views including HTML views, PDF and ePub downloads, according to the available data) and Abstracts Views on Vision4Press platform.
Data correspond to usage on the plateform after 2015. The current usage metrics is available 48-96 hours after online publication and is updated daily on week days.
Initial download of the metrics may take a while.