Fig. 6
Download original image
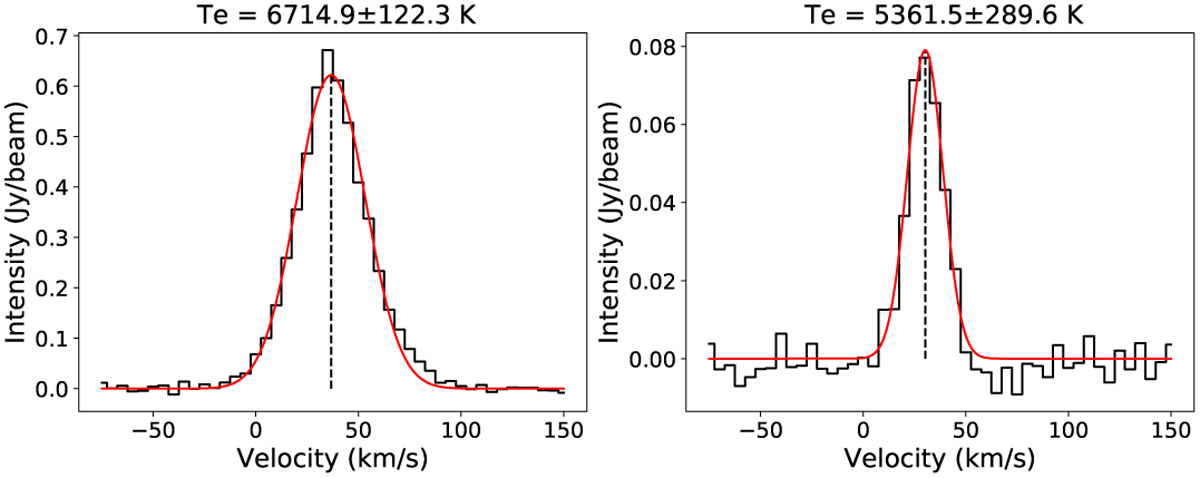
Example of Gaussian fitted GLOSTAR stacked recombination line corresponding to the peak emission toward W33 Main (left panel) and G12.81−0.22 (right panel). Toward the peak emission of W33 Main, the line amplitude, line width, and velocity were found to be 622 ± 8.6 mJy beam−1, 39.3 ± 0.6 km s−1, and 36.7 ± 0.3 km s−1, respectively. For G12.81−0.22, toward the peak emission, the line amplitude, line width, and velocity were found to be 79.1 ± 2.9 mJy beam−1, 20.4 ± 0.9 km s−1 and 30.2 ± 0.4 km s−1, respectively.
Current usage metrics show cumulative count of Article Views (full-text article views including HTML views, PDF and ePub downloads, according to the available data) and Abstracts Views on Vision4Press platform.
Data correspond to usage on the plateform after 2015. The current usage metrics is available 48-96 hours after online publication and is updated daily on week days.
Initial download of the metrics may take a while.