Fig. 2
Download original image
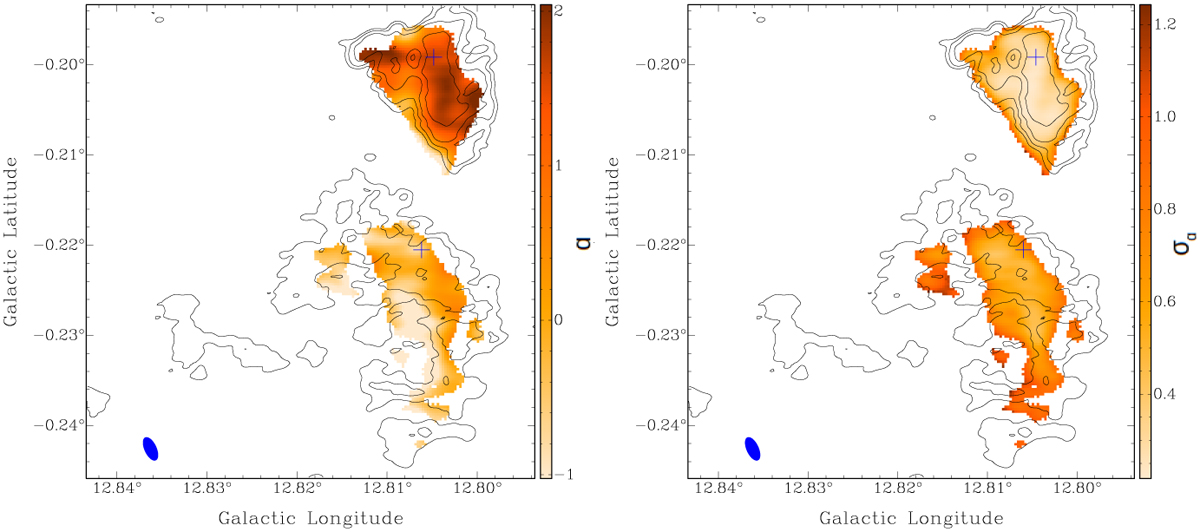
Maps of the spectral index between the continuum emission at 610 MHz and 1400 MHz (left panel) and its uncertainty (right panel) of W33 Main and G12.81−0.22, overlaid with contours of the radio emission at 1400 MHz at full resolution. The contour levels are as described in Fig. 1 (left panel). The blue-filled ellipse shows the corresponding beam size. The blue cross corresponds to peak emission toward W33 Main and G12.81−0.22 at 1400 MHz.
Current usage metrics show cumulative count of Article Views (full-text article views including HTML views, PDF and ePub downloads, according to the available data) and Abstracts Views on Vision4Press platform.
Data correspond to usage on the plateform after 2015. The current usage metrics is available 48-96 hours after online publication and is updated daily on week days.
Initial download of the metrics may take a while.