Fig. A.1.
Download original image
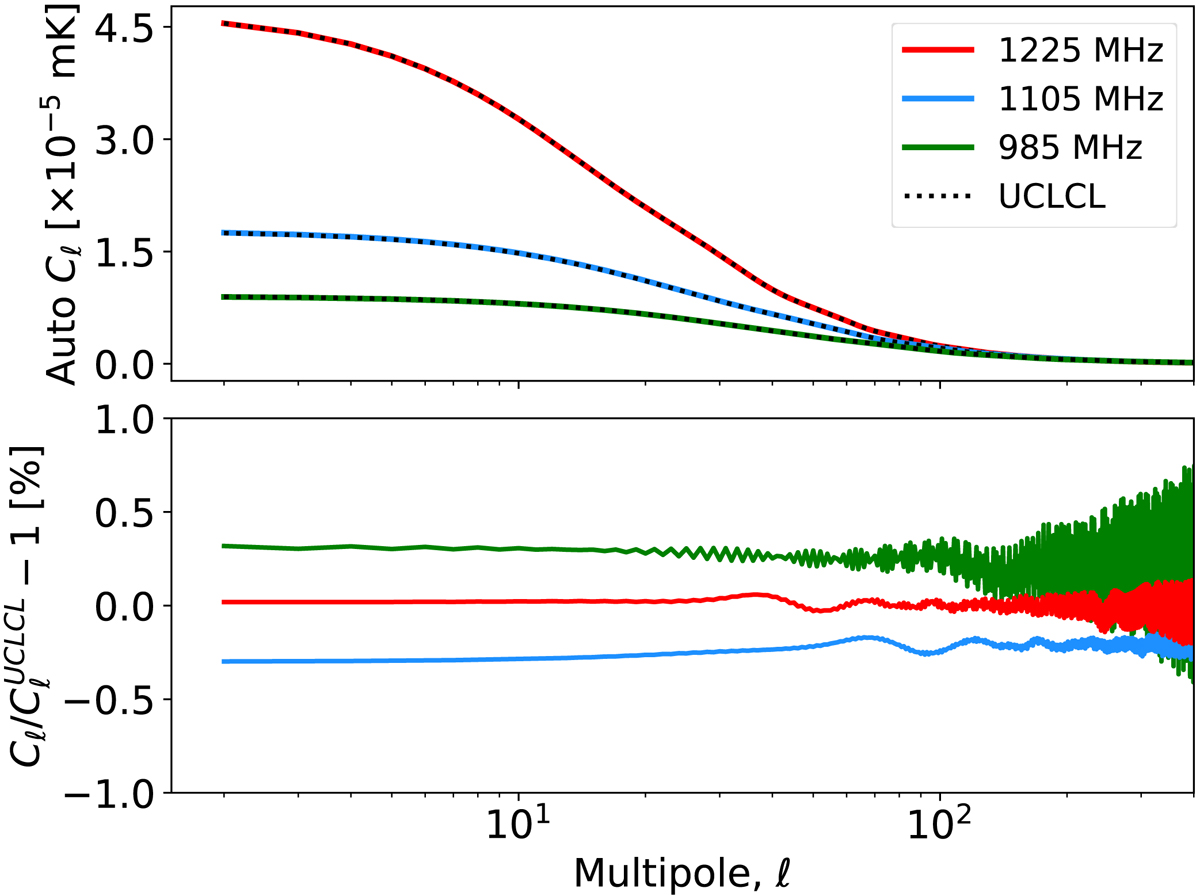
Comparison between the auto-correlation ![]() s (for i = j) calculated in this work and those obtained with the UCLCL code at three BINGO redshift bins, centered at the frequencies 985, 1105, and 1225 MHz (redshifts z ≈ 0.44, 0.28, and 0.16, respectively), and bandwidths of 10 MHz. The upper panel shows the UCLCL results overplotted as dotted lines on each of the calculated curves (colored lines), while the lower panel shows the percentage relative difference among them.
s (for i = j) calculated in this work and those obtained with the UCLCL code at three BINGO redshift bins, centered at the frequencies 985, 1105, and 1225 MHz (redshifts z ≈ 0.44, 0.28, and 0.16, respectively), and bandwidths of 10 MHz. The upper panel shows the UCLCL results overplotted as dotted lines on each of the calculated curves (colored lines), while the lower panel shows the percentage relative difference among them.
Current usage metrics show cumulative count of Article Views (full-text article views including HTML views, PDF and ePub downloads, according to the available data) and Abstracts Views on Vision4Press platform.
Data correspond to usage on the plateform after 2015. The current usage metrics is available 48-96 hours after online publication and is updated daily on week days.
Initial download of the metrics may take a while.