Fig. 15.
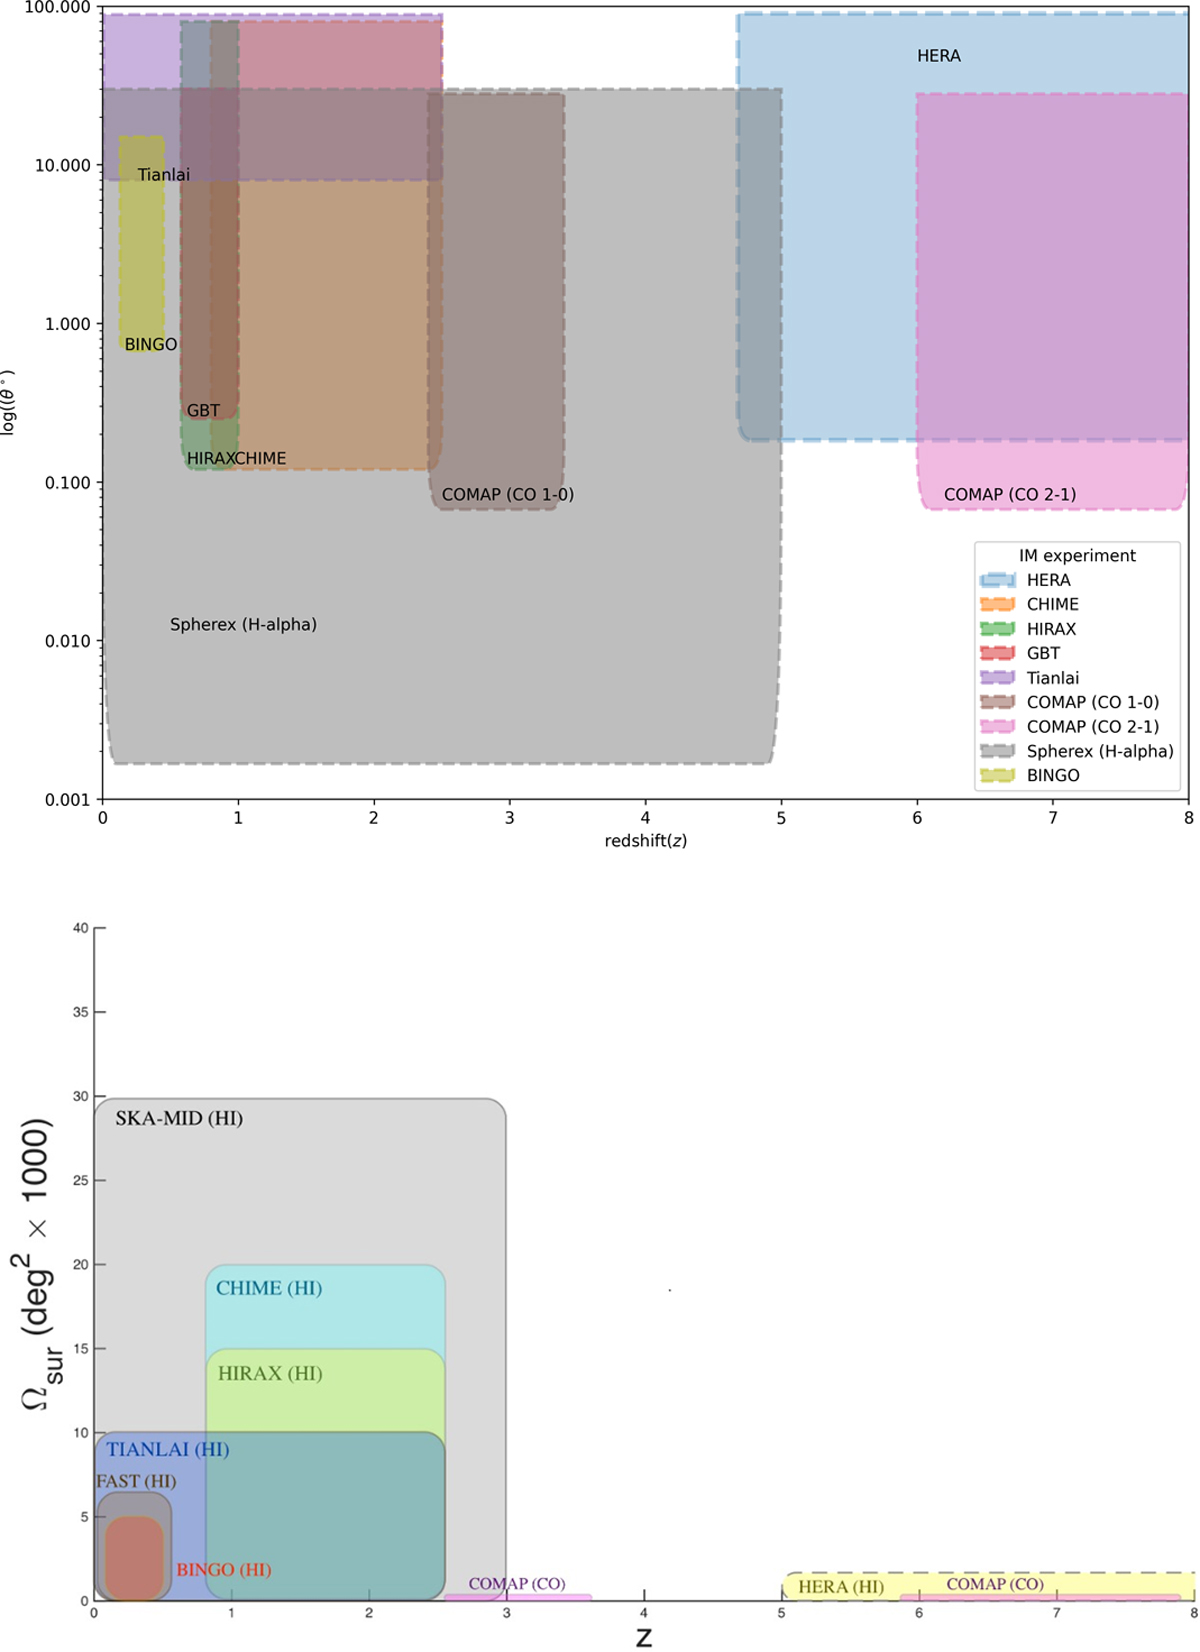
Download original image
Top: comparative plot of angular resolution versus redshift coverage for different IM experiments. The red rectangle with the arrow shows the approximate spot for BINGO (adapted from Kovetz et al. 2017). Bottom: figure from Wuensche et al. (2021), showing a comparative plot of the sky and redshift coverage for different IM experiments. From those, CHIME, FAST and Tianlai are already in operation.
Current usage metrics show cumulative count of Article Views (full-text article views including HTML views, PDF and ePub downloads, according to the available data) and Abstracts Views on Vision4Press platform.
Data correspond to usage on the plateform after 2015. The current usage metrics is available 48-96 hours after online publication and is updated daily on week days.
Initial download of the metrics may take a while.