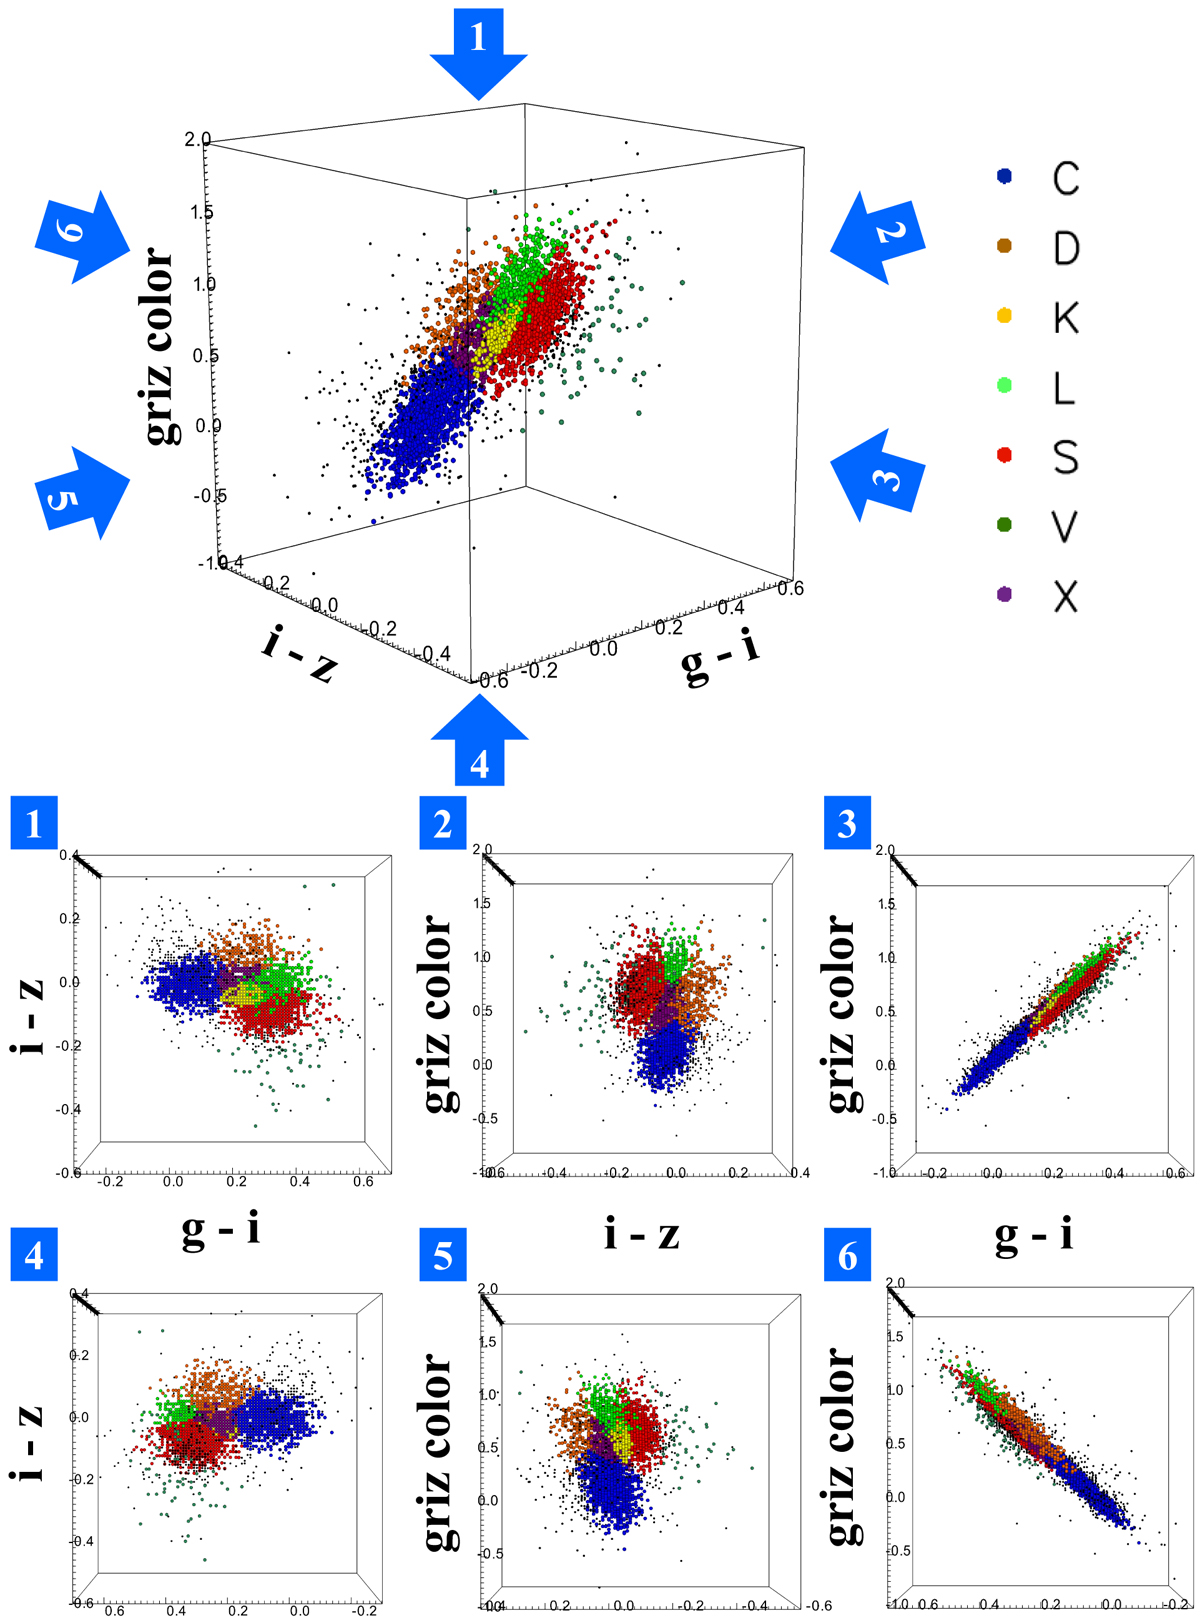
Fig. 6
Download original image
Perspective view of the 3D clustering results in method B. The color-coding is the same as in Fig. 4. Different colors correspond to different taxonomy classification memberships for C (blue), D (orange red), K (yellow), L (lime), S (red), V (lime green), X (purple), and unassigned (black). The overlapping members of each type in the 2D plane seem to be separated by relatively clear boundaries in 3D space.
Current usage metrics show cumulative count of Article Views (full-text article views including HTML views, PDF and ePub downloads, according to the available data) and Abstracts Views on Vision4Press platform.
Data correspond to usage on the plateform after 2015. The current usage metrics is available 48-96 hours after online publication and is updated daily on week days.
Initial download of the metrics may take a while.