Fig. 5
Download original image
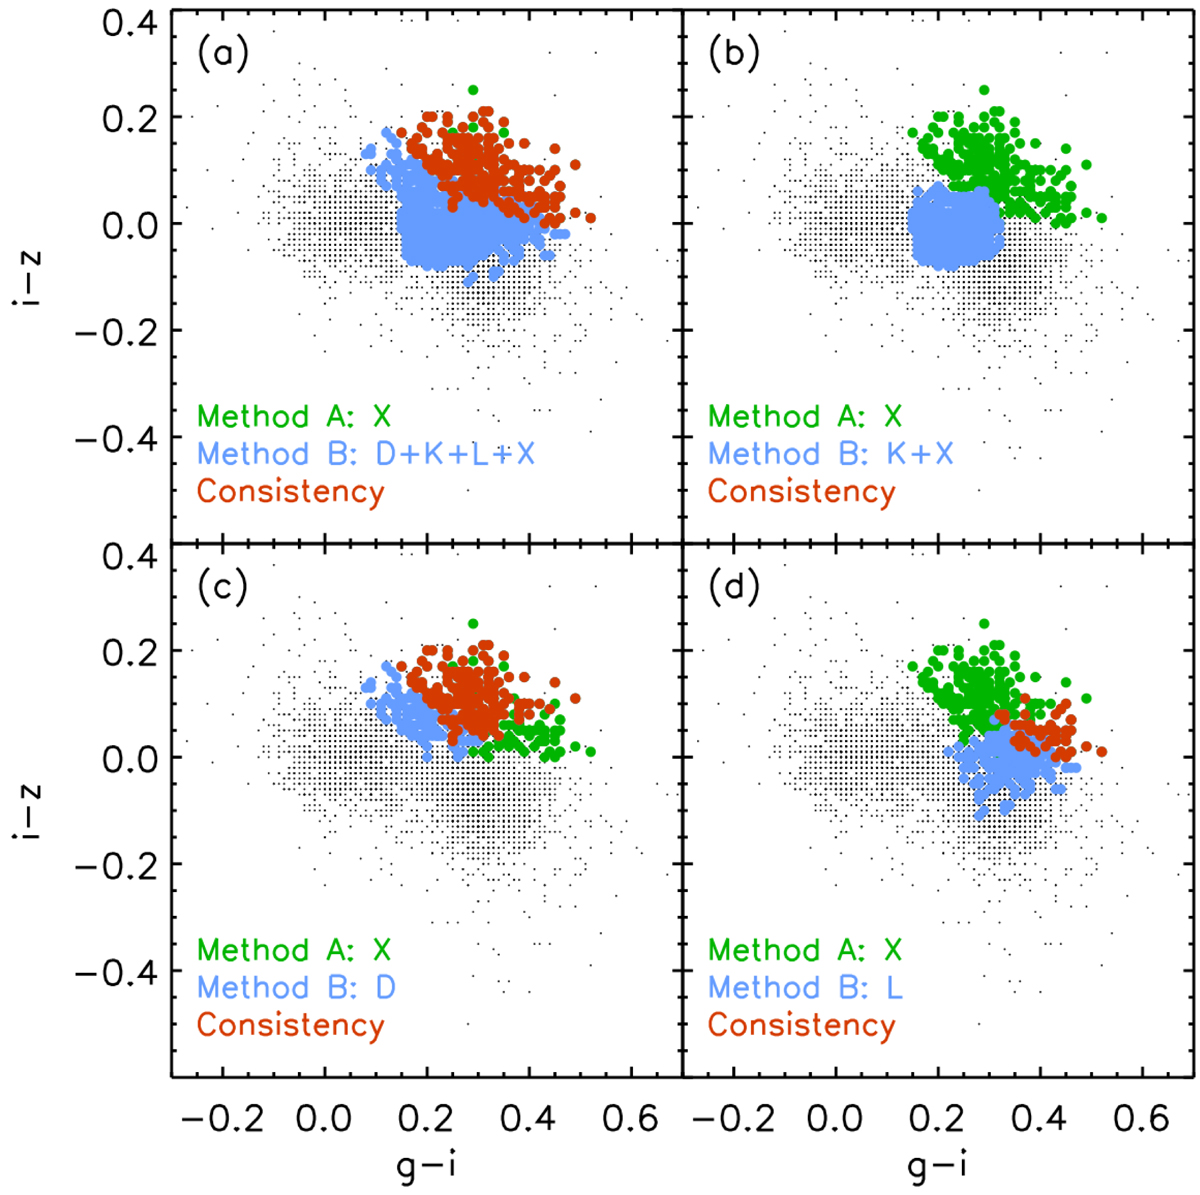
Two-dimensional projection plots for consistent taxonomy objects. Different colors correspond to X-type assignments in method A (green; consistent objects in method A1 and A2), comparative taxonomy types in method B (blue), consistent objects between method A and B assignments (red), and all our samples (black). D- and L-type objects in method B correspond to a large portion of objects with X type in the method A result, whereas K and X types in method B do not correspond to X type in method A.
Current usage metrics show cumulative count of Article Views (full-text article views including HTML views, PDF and ePub downloads, according to the available data) and Abstracts Views on Vision4Press platform.
Data correspond to usage on the plateform after 2015. The current usage metrics is available 48-96 hours after online publication and is updated daily on week days.
Initial download of the metrics may take a while.