Free Access
Fig. 6.
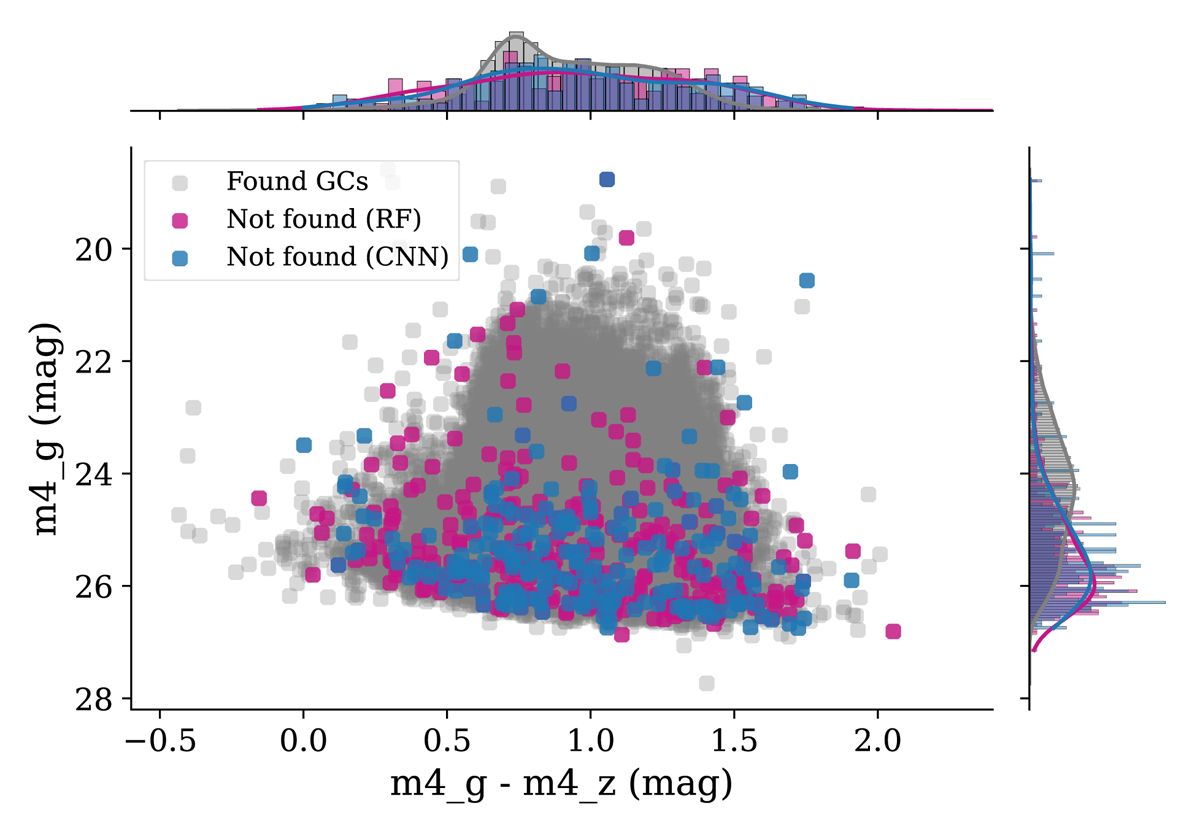
Download original image
Colour-magnitude diagram showing the recovered GCs in grey. Sources in pink and blue refer to sources labelled as GCs that were not found (false negatives) by the RF or CNN method applied to the full data set, respectively.
Current usage metrics show cumulative count of Article Views (full-text article views including HTML views, PDF and ePub downloads, according to the available data) and Abstracts Views on Vision4Press platform.
Data correspond to usage on the plateform after 2015. The current usage metrics is available 48-96 hours after online publication and is updated daily on week days.
Initial download of the metrics may take a while.